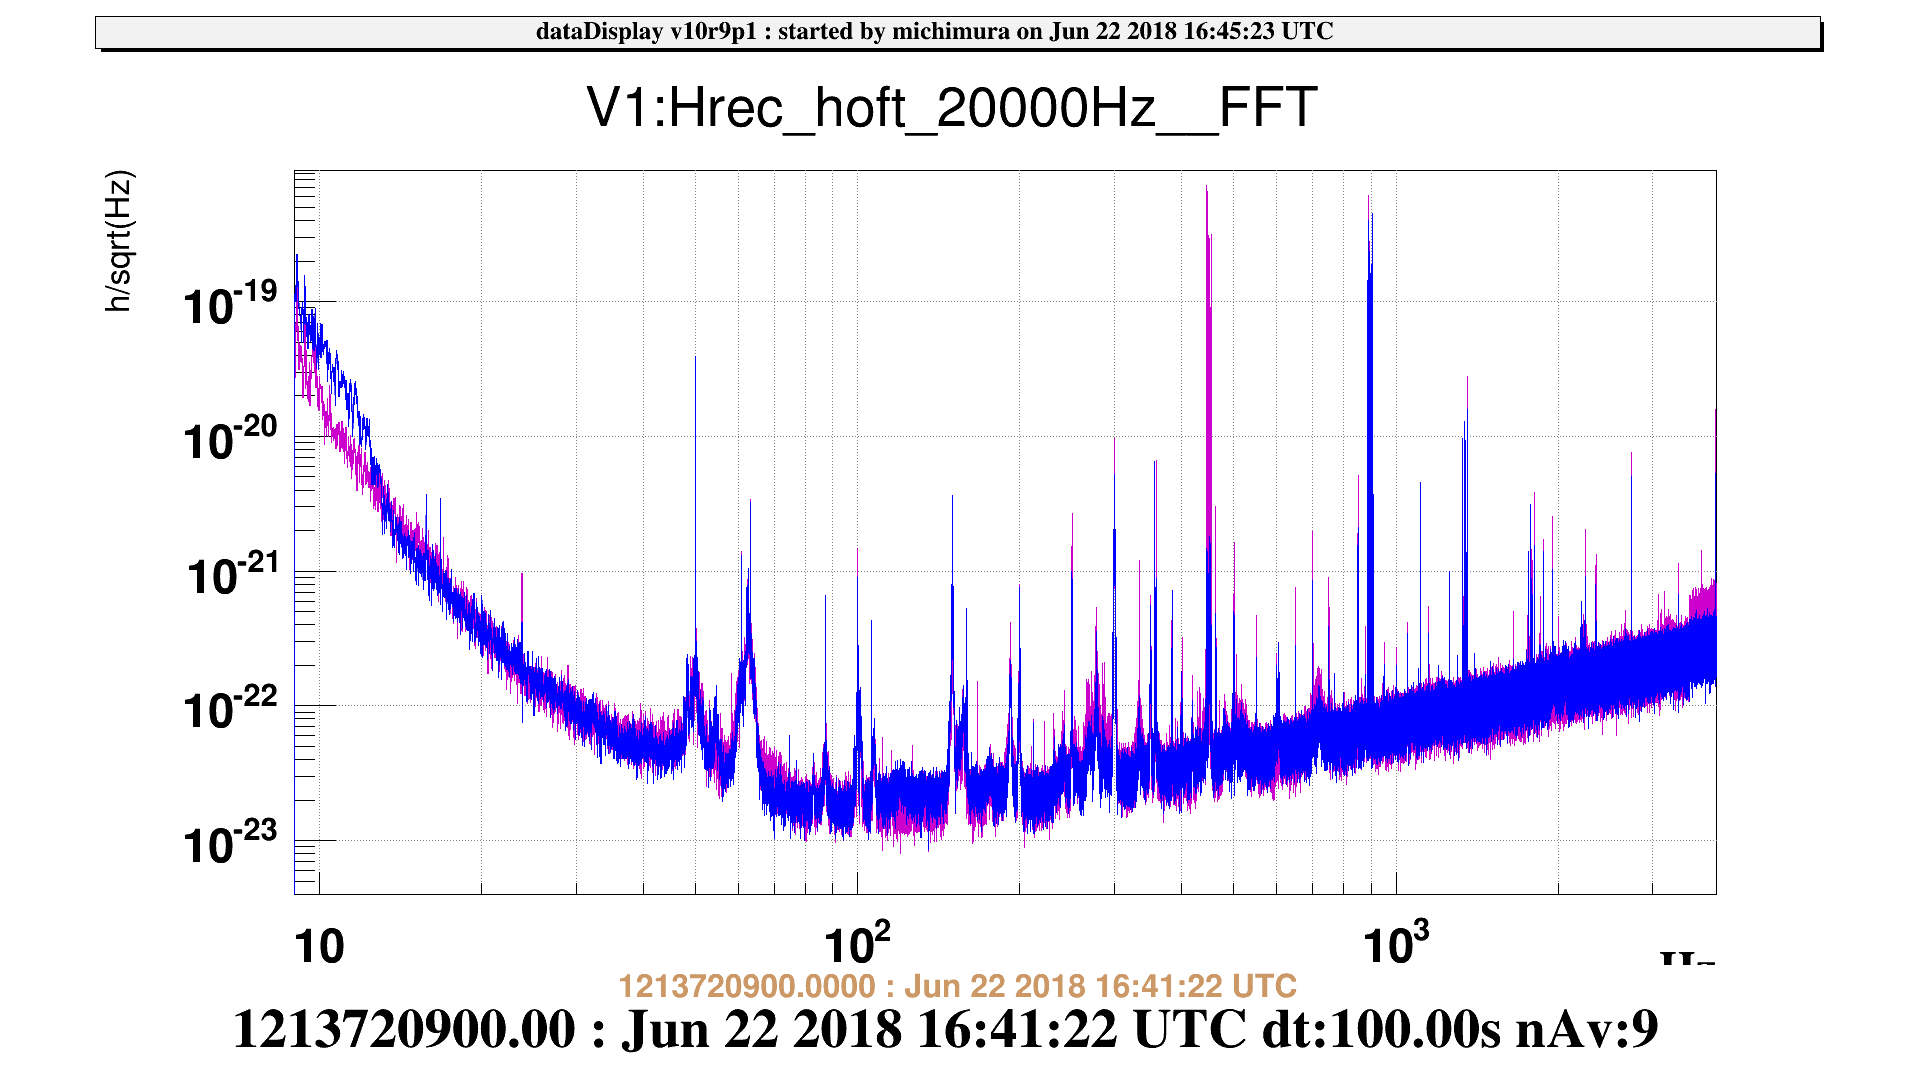
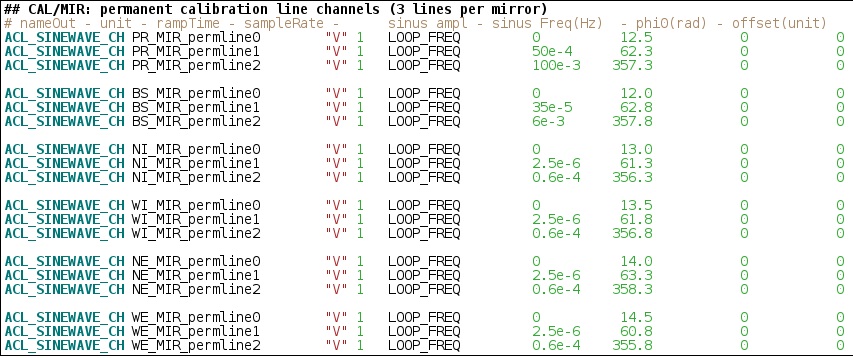
For the record, the peaks at ~60 Hz are calibration lines (see attached). Nominally, only the lines appear in DARM. However, there was an elevated bump during the timing issues (and when Bas made his plot); this bump is also elevated during our IB shaker tests. We have plans to investigate possible scattered light associated with these, but since nominally the bump is absent in Hrec, perhaps just the subtraction could be made better.

With lots of help from ISC, I've made an optical sensor diagram of aVirgo. I've put in on TDS as document VIR-0441A-18. Keep in mind many of these sensors aren't being actively used. Any corrections/comments welcome. This was made using Inkscape, so I will upload .svg file as well soon.

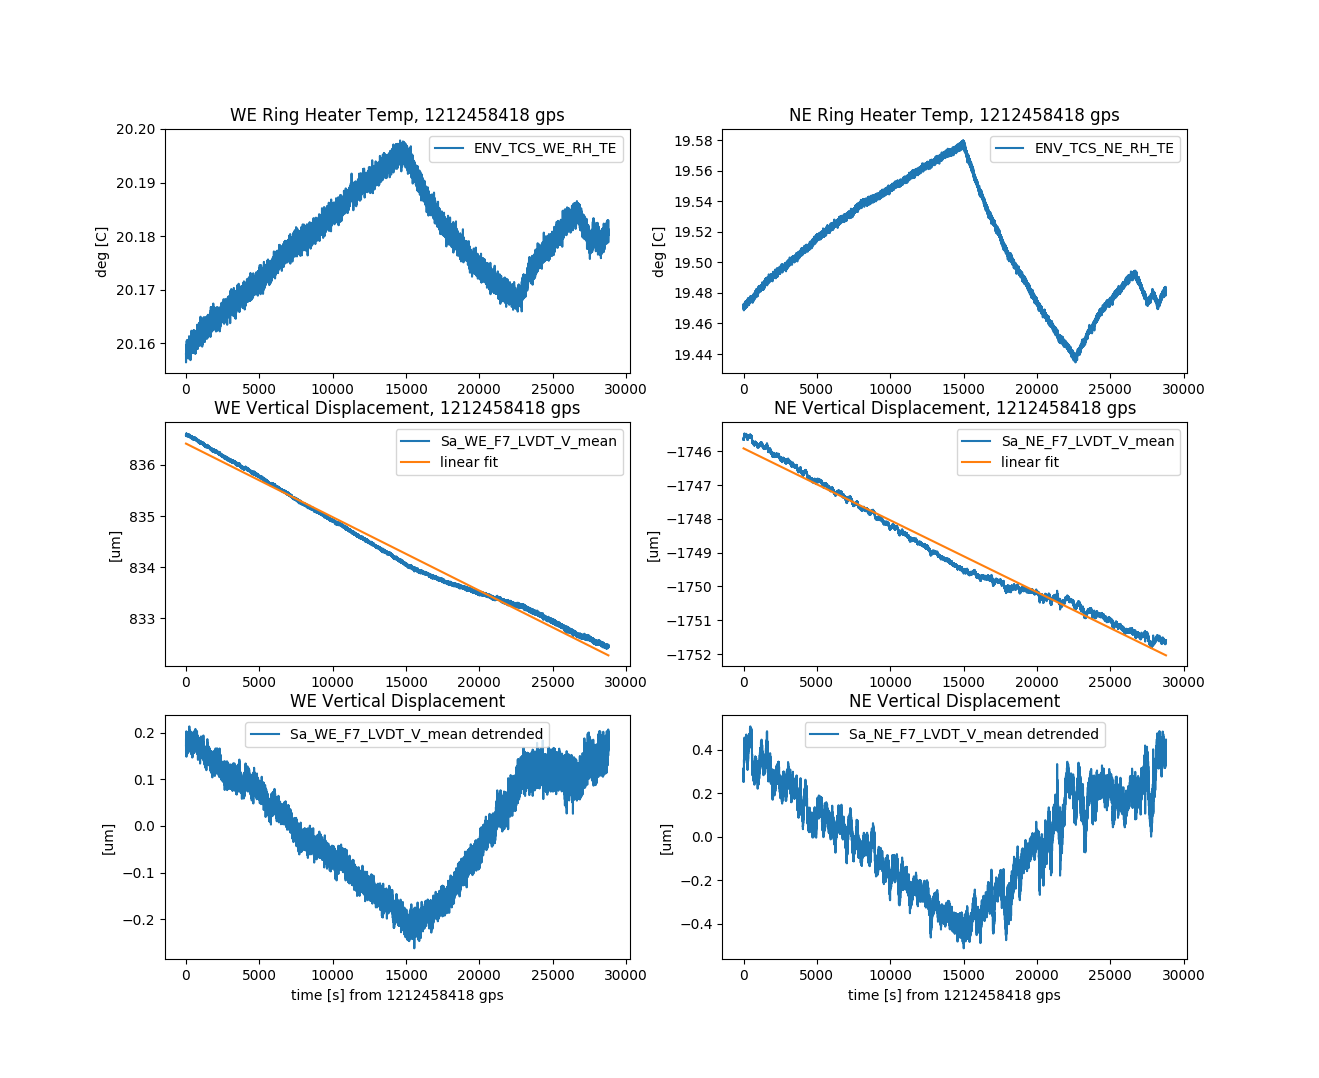
As noted previously, the NE ring heater temperature sensors see larger temperature changes with lock/locklosses. To check if this is just a RH TE calibration error, I looked at the vertical drift (the blade springs sag or stiffen with temperature and thus are a best true change-of-temperature sensor). Daily ambient temperatures dominate, so I roughly subtracted this by finding lockloss during a mostly linear vertical drift time and detrending linearly. The residual confirms what the ring heater temp sensors see: NE tower sees ~2x temperature change compared to WE during lock/lockloss. The attached plot shows the end ring heater temp sensors, the linear fit on the raw vertical data (I use vertical sensors above the marionetta and in payload chamber), and the detrended vertical data. I looked also since the power increase, but we've had few locks; it looks comparable now at 25W but the ambient temp looks less linear in the lock times, making simple linear detrend less reliable. Should be investigated more with cleaner data/better subtraction. Script is in /users/hardwick/scripts/mirror_temp.py. Just need to change time and duration.
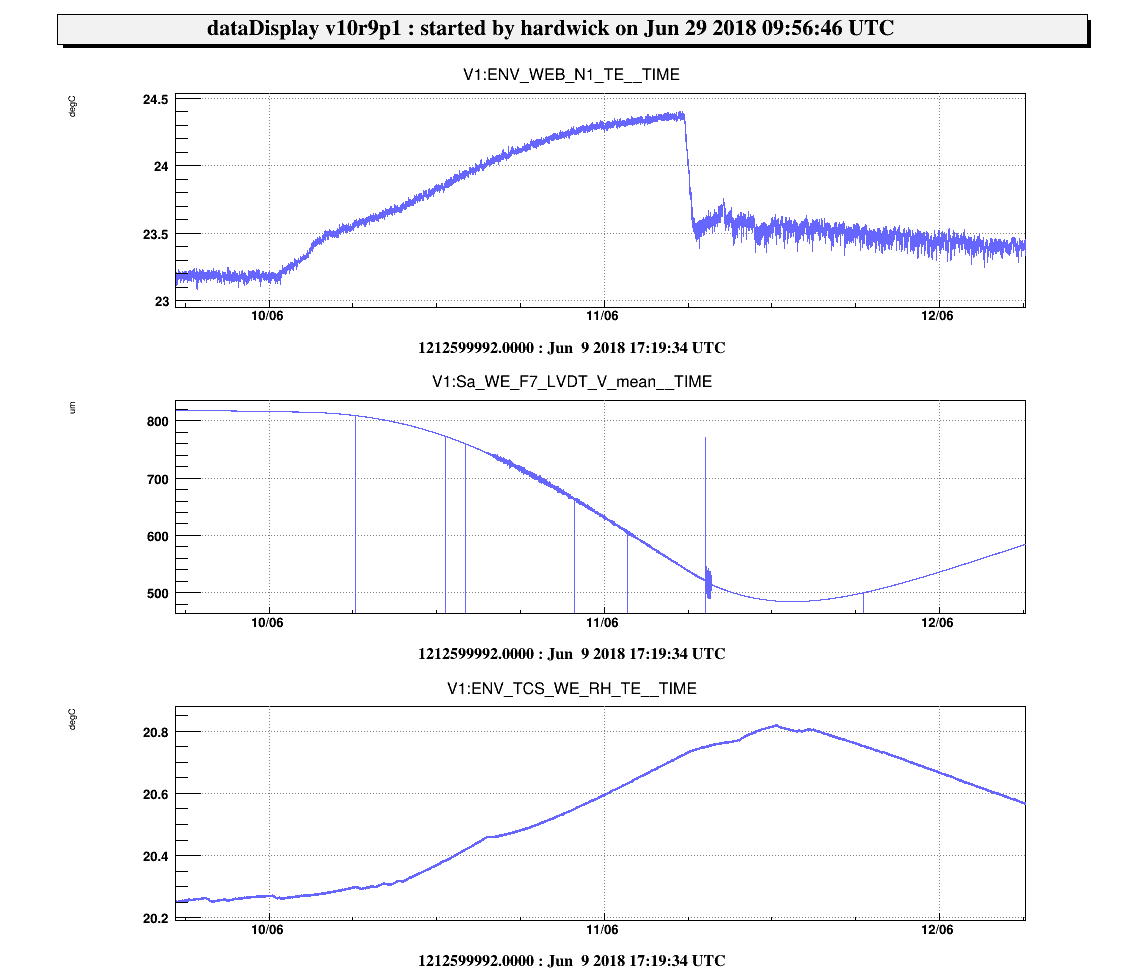
I also looked again at the west end during the large temp change when the air conditioning went off; shown here. We can roughly calibrate: 0.36 RH degC / 1 WEB degC and 235 um Vert / 1 WEB degC. Note this doesnt take into account the lock which held for the beginning part of the large ambient temp change.


After the increase of the input power we have tried to recover the lock of the ITF. We managed to reach LOW_NOISE1 succesfully with 25 W  , but we got stucked while locking the OMC1. A few comments:
- There was a huge oscillation around 10Hz growing caused by the vertical dampers of the cavity mirrors. Paolo told me to de-activate them during the lock acquisition and turn them on in DF. Unfortunately, in DF they were producing the same effect. To be checked tomorrow.
- When unlocking, the IMC would oscillate more than usual (10urad amplitude oscillations), taking long time to calm down.
- I anticipated the hand-off to B7/B8 PDs at 0.5 offset, since it would saturate at 0.3.
- We had an unlock due to shutter closing of the B1p at 0.1 of MICH offset. Romain B. updated the threshold level to mitigate the problem, but it happened few times more. To be monitored.
- The 6MHz is turned off as it was done in the past.
Tomorrow morning we should start by the lock of the OMC1. We leave the ITF in recombined for the night.
PS. We tested the GUI of the longitudinal loops, changing succesfully some gains and filters! 
In order to better analyze the arms mode content, we performed a cavity scan for each arm in "cold" mirror condition: indeed, the two arms have been unlocked for the whole weekend. Today, we only had a 1 hour-ish lock in dark fringe, and during this time the TMs didn't have the time to fully thermalize. So we can consider the mirrors "cold" enough.
Moreover, in order to better highlight HOMs, we intentionally misaligned a bit the cavity, and we reduced the 6MHz modulation depth as much as the RFC lock allowed (3dBm).
GPS North arm: 1213982458
GPS West arm: 1213981652
Analysis will follow
From a closer look to the cavity scans, it seems that the main HOMs visible in the FSR belong to the sidebands, mostly from the 8MHz, whose modulation depth had not been decreased. In figure 1, one FSR of the North arm is shown: first subplot is the transmitted power, following subplots are 8MHz, 6MHz and 56MHz respectively. In figure 2, the same plot for the West arm is shown.
To measure the carrier HOMs ALL the modulation depth must be decreased (as much as possible, as not to unlock the RFC), and the mutual misalignment between arm cavity and input beam has to be further increased in order to enhance HOMs.


I noticed that ~60 Hz peaks were also excited in RFC Err during these IB tower shaking tests even when we were only driving close to 100 Hz (blue line). As Bas has noted, these peaks are some of the worst for DARM.

We've looked at the times during shaker injections. We suspect that 101 Hz is not caused by the RFC minilink or by some structure on the suspended bench, but perhaps by some structure attached to the chamber wall inside (is there some lip where the minilink meets the wall that could have its own resonance?).
- 101 Hz is not a resonance of the RFC minilink. We see no resonant peak in the minilink accelerometer. While there is coherence around 101 Hz between RFC Err and accelerometer, there is less coherence right at the 101 Hz peak seen in RFC Err.
- 101 Hz is not a resonance of some structure on the bench. Noise in Sc_MC_RFC_Err_Post scales as 1/2 the RFC minilink motion (IB_BD_ACC) and the same as chamber wall motion (IB_ACC_X). Unless there is a mechanical short between the chamber wall and the suspended bench, motion of some bench structure (optics mount, etc.) should be attentuated relative to chamber wall motion.
- Additionally, this doesn't look like two structures moving/modulating scattered light; the motion of the chamber wall/minilink is large (10-4 m/s2) compared to wavelength, so we would expect broad noise peak, not the narrow line we see in RFC Err/DARM.
I attach spectrum during no injections and two different shaker injections, showing the accelerometers and error signals mentioned in original post. In the plots: purple is no injection, green is 75-125 Hz shaker injection, and blue is 95-105 Hz shaker injection.

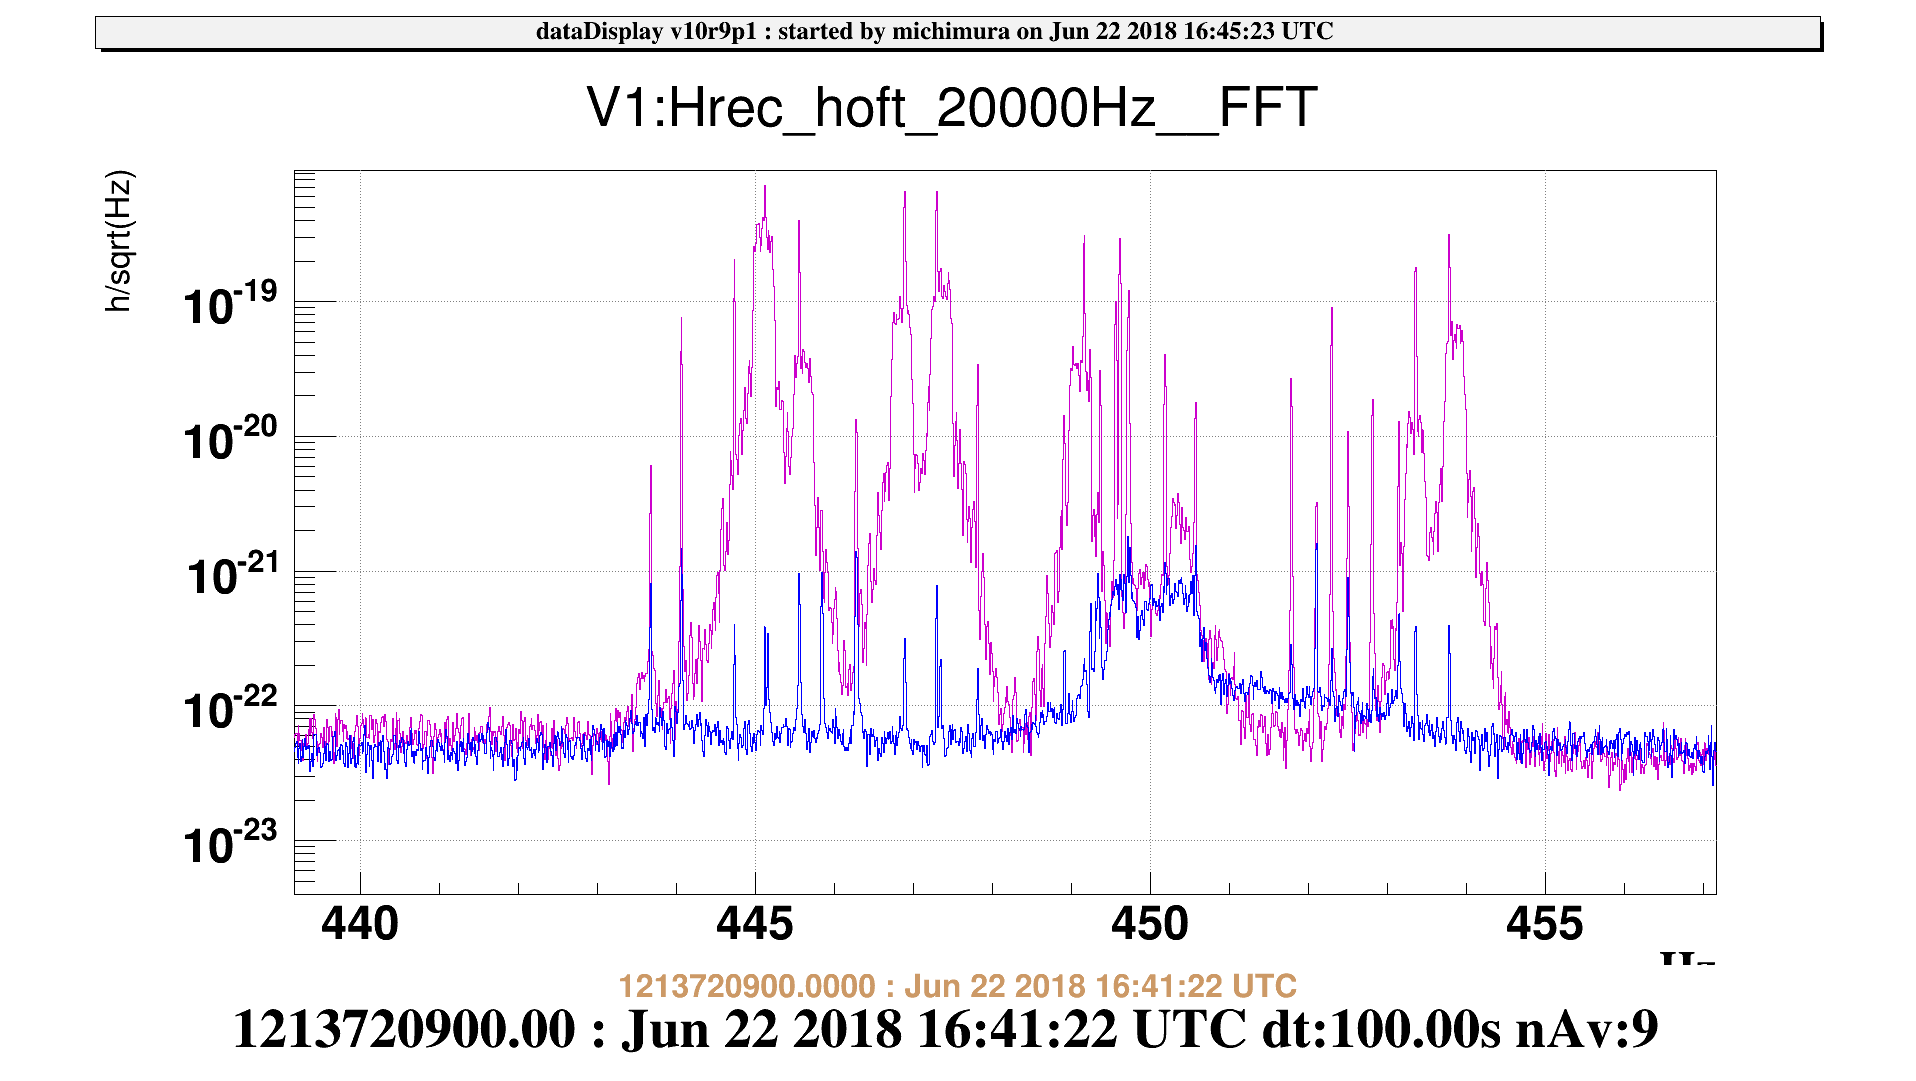
We've found filters and gains that damp all modes. All violin mode (1st harmonics) are damped to under 2e-21 in strain, shown in Hrec here (and zoomed here).
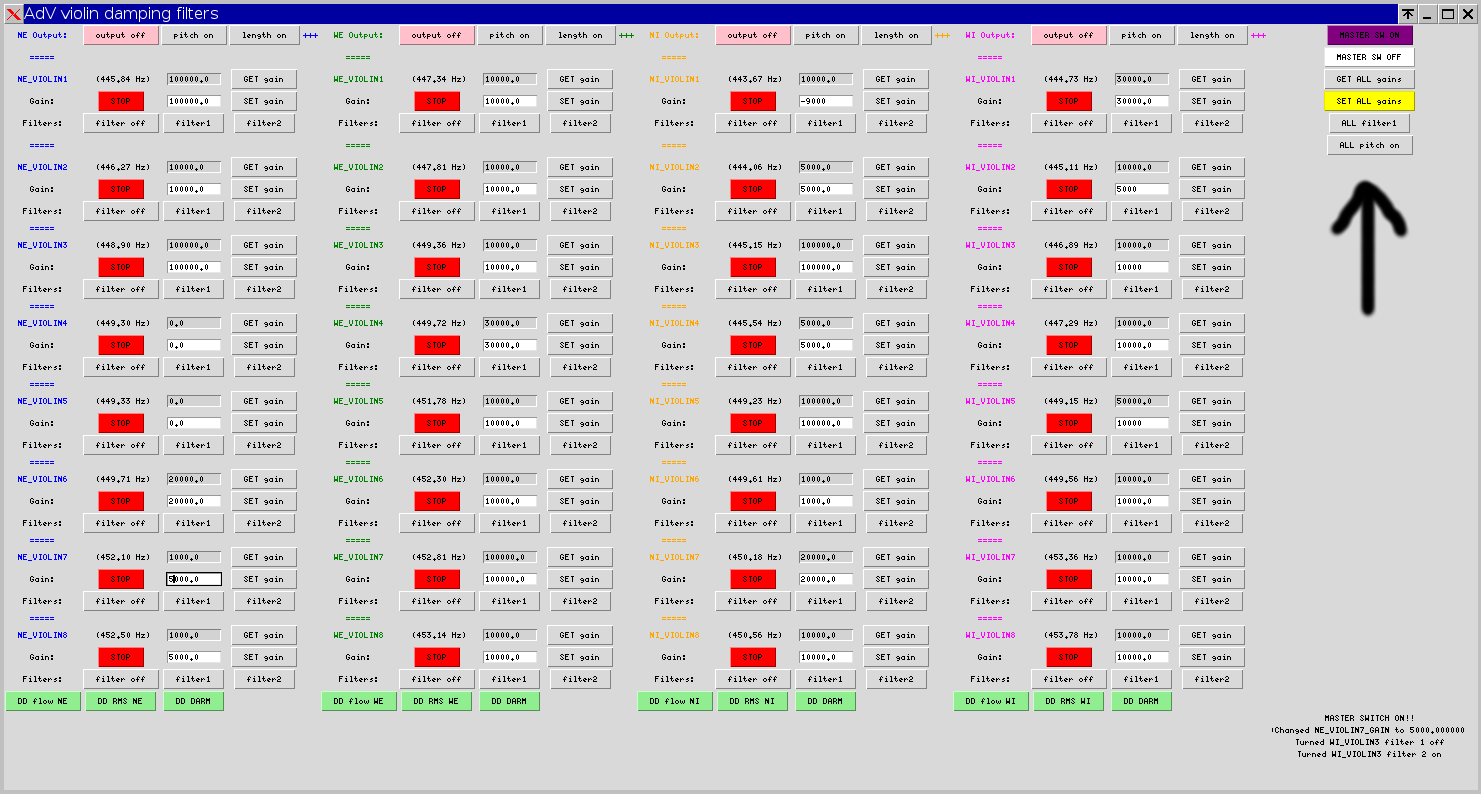
Since gain values may need to be changed, we've keep the config default values as zero; the working values are stored in the GUI code. After a recompile, you can press "SET ALL gains" to reset to these values. The current working settings are also attached here. We note that only WI requires 60 deg phase correction (use filter 2). We haven't checked to see if all WI modes damp better with this.
At max, we are driving 0.02 V per correction signal.


Early afternoon we injected some band limited noise with the shaker (big one) attached on the IB tower at platform level.
We encoutered some difficulties it doing the test in LOW-noise 3 because when starting the shaker although with very low noise level (and having set a 2s ramp time in the noise) we excited the IB suspension and unlocked. We then took some data with the ITF in state 62 (thought it was recombined as this morning, ...but actually not exactly (Figure 1). We see we excited by a factor 2 or so the 101Hz peak (apparently nothig else) while the accelerometers on IB N-flange (ENV_IB_ACC_X) and on RFC beam flange (ENV_ACC_IB_BD_Z) measured and increase of floor noise of about a factor 10 (Figure 2).
Here the gps:
colored noise, band 10Hz 290Hz
level 0.001
1213700049 Jun22,18-10:54:09 UTC (Jun22,18-12:54:09 CEST) -> unlock
level 0.001
1213711259 Jun22,18-14:00:59 UTC (Jun22,18-16:00:59 CEST) -> unlock
0.01 (75Hz-125Hz)
1213712415 Jun22,18-14:20:15 UTC (Jun22,18-16:20:15 CEST)
0.003
1213712643 Jun22,18-14:24:03 UTC (Jun22,18-16:24:03 CEST)
0.001
1213712767 Jun22,18-14:26:07 UTC (Jun22,18-16:26:07 CEST)
0.001 (95Hz-105Hz)
1213712878 Jun22,18-14:27:58 UTC (Jun22,18-16:27:58 CEST)
0.005
1213712979 Jun22,18-14:29:39 UTC (Jun22,18-16:29:39 CEST)
end
1213713165 Jun22,18-14:32:45 UTC (Jun22,18-16:32:45 CEST)


We've looked at the times during shaker injections. We suspect that 101 Hz is not caused by the RFC minilink or by some structure on the suspended bench, but perhaps by some structure attached to the chamber wall inside (is there some lip where the minilink meets the wall that could have its own resonance?).
- 101 Hz is not a resonance of the RFC minilink. We see no resonant peak in the minilink accelerometer. While there is coherence around 101 Hz between RFC Err and accelerometer, there is less coherence right at the 101 Hz peak seen in RFC Err.
- 101 Hz is not a resonance of some structure on the bench. Noise in Sc_MC_RFC_Err_Post scales as 1/2 the RFC minilink motion (IB_BD_ACC) and the same as chamber wall motion (IB_ACC_X). Unless there is a mechanical short between the chamber wall and the suspended bench, motion of some bench structure (optics mount, etc.) should be attentuated relative to chamber wall motion.
- Additionally, this doesn't look like two structures moving/modulating scattered light; the motion of the chamber wall/minilink is large (10-4 m/s2) compared to wavelength, so we would expect broad noise peak, not the narrow line we see in RFC Err/DARM.
I attach spectrum during no injections and two different shaker injections, showing the accelerometers and error signals mentioned in original post. In the plots: purple is no injection, green is 75-125 Hz shaker injection, and blue is 95-105 Hz shaker injection.
I noticed that ~60 Hz peaks were also excited in RFC Err during these IB tower shaking tests even when we were only driving close to 100 Hz (blue line). As Bas has noted, these peaks are some of the worst for DARM.
In that confirguration, I think you were locked in recombined but not CARM to MC.
In the morning, we mostly worked in the states CARM to MC and LOCKED SSFS.
It would have been interesting to do it also in these 2 ITF states.
By the way, looking at the data it seems we can find coherence with the RFC error signal (mostly with accelerometers located north side of IB tower).
Even the SPRB one is coherent with the RFC error signal in several regions.
Two additional observations:
when shaking the IB tower tank several peaks excite in the RFC signal (Figure 1), the 62Hz was already noticed by Terra. Among them the only one that is coherent with IB tower tank accelerometer also in quiet condition is the 101.Hz.
the shape of these 101Hz (Figure 2) and 62Hz (Figure 3) peaks match very well the shape of the peaks that got excited when Maddalena injected noise on IB angular controls ( 41956): see Figures 2 and 3. These peaks should be mechanical modes of SIB1 last stage suspension (quoting Paolo) (broadband noise injected on SIB1 coils should definitely prove it). Figure 2 also shows that also the shape of 101Hz peak in Hrec maches. Figure 3 shows that instead the structure in Hrec around 62Hz was something else.


In order to investigate for peaks at 101 Hz, 107 Hz, 157 Hz (41824) today we performed tappings in the area between IB and SIB2, including various spots along the B2 and RFC minilinks. We did it first with only RFC locked and ITF in recombined (INDEX = 82), then we repeated with SSFS locked (ITF index = 92). Figures 1 and 2 show the tapping locations in the first and second round respectively. We used the electronic hammer as a tool (but not acquired) and at some point (indicated below) we connected channel ENV_IB_BD_ACC_Z (usually connected to the PCB accelerometer on the W-flange beam dump) to one small accelerometer which we sticked in a few places (described below) and finally we left it sticked on the RFC flange (IB side) in horizontal direction.
Here the detailed time list:
***** tapping test in SIB2 room 22/06/2018 ****************
signals: Sc_MC_RFC_Err_Post (error signal for the IMC length lock, which in our case was using B4 (CARM error signal) and not RFC)


****************************************************************************************************************************************************************************************

******  recombined mode (PR misaligned, arms locked, carm to MC we use RFC error signal for the correction to the mode cleaner) ****
GPS given in LOCAL TIME
reference: 09:13:00
* is where we see well the 101Hz peak excited
1)  09:22:05 --> 09:23:10		B2 minilink SIB2 side
2)  09:23:31 --> 09:24:15		B2 minilink middle
3)  09:24:50 --> 09:25:35		B2 minilink INJ tower side
4)  09:25:54 --> 09:26:27
5)  09:27:12 --> 09:27:34
6)  09:29:38 --> 09:30:04	*	flange
7)  09:31:13 --> 09:32:00	*	in the middle of the REF minilink
8)  09:32:27 --> 09:32:59	*
9)  09:33:15 --> 09:34:02	*
10) 09:35:27 --> 09:36:05		lateral flange IB
11) 09:40:30 --> 09:40:48		small flange
12) 09:41:17 --> 09:41:31
13) 09:41:32 --> 09:41:47
14) 09:42:14 --> 09:42:21
15) 09:42:35 --> 09:42:43
16) 09:42:50 --> 09:43:58
17) 09:43:50 --> 09:43:58
18) 09:44:04 --> 09:44:15
19) 09:44:30 --> ?		*
20) 09:44:45 --> 09:44:58	*
21) 09:45:41 --> 09:45:55
22) 09:54:03 --> 09:54:20		from inside SIB2, close to the window --> nothing
23) 09:54:48 --> 09:55:01 		same as 23

*** we put the accelerometer (ENV_IB_BD_ACC_Z) in the vertical direction on the RFC pipe (in the middle).
24) 10:31:34 --> 10:32:42  tapping on the minilink

****************************************************************************************************************************************************************************************

******** measurement with SSFS engaged ***********
new reference: 10:41:00

Signals:
- Sc_MC_RFC_Err_Post (even if the RFC is unlocked it is still the signal to look at)
- ENV_IB_BD_ACC_X on the big flange, north side
- ENV_IB_BD_ACC_Z on hte RFC minilink, along the beam direction

1)  10:43:24 --> 10:44:01	on the REF cavity minilink, close to INJ tower, along the beam direction
2)  unlock
3)  10:51:23 --> 10:52:03	"			"		      , along the vertical direction
4)  10:52:14 --> 10:52:39	on the B2 cavity minilink, close to INJ tower, along the beam direction
5)  10:52:51 --> 10:52:07
6)  10:53:17 --> 10:53:40	on the beam dump, along the beam direction
7)  10:53:52 --> 10:54:09	at the center of the flange
8)  10:54:19 --> 10:54:32	close to RFC pipe	*
9)  10:54:40 --> 10:54:49	closer to RFC pipe	*
10) 11:01:28 --> 11:01:50	RFC minilink, close to INJ tower, along the beam direction
11) 11:02:50 --> 11:02:25	RFC minilink, in the middle, along the beam direction
12) 11:02:40 --> 11:03:08	RFC minilink, close to INJ tower, in the vertical direction
13) 11:03:22 --> 11:03:45	RFC minilinj, close to SIB2, on the beam direction
14) 11:03:54 --> 11:04:20	as 10
15) 11:08:35 --> 11:08:55
16) 11:10:24 --> 11:10:32 	tapping on the flange, next to RFC minilink, in the direction of the beam
17) 11:11:30 --> 11:11:40
18) 11:15:52 --> 11:16:05
19) 11:16:25 --> 11:16:45	side of the flange, next to the rfc minilink
20) 11:29:24 --> 11:29:59	on the side of the flange, transverse direction


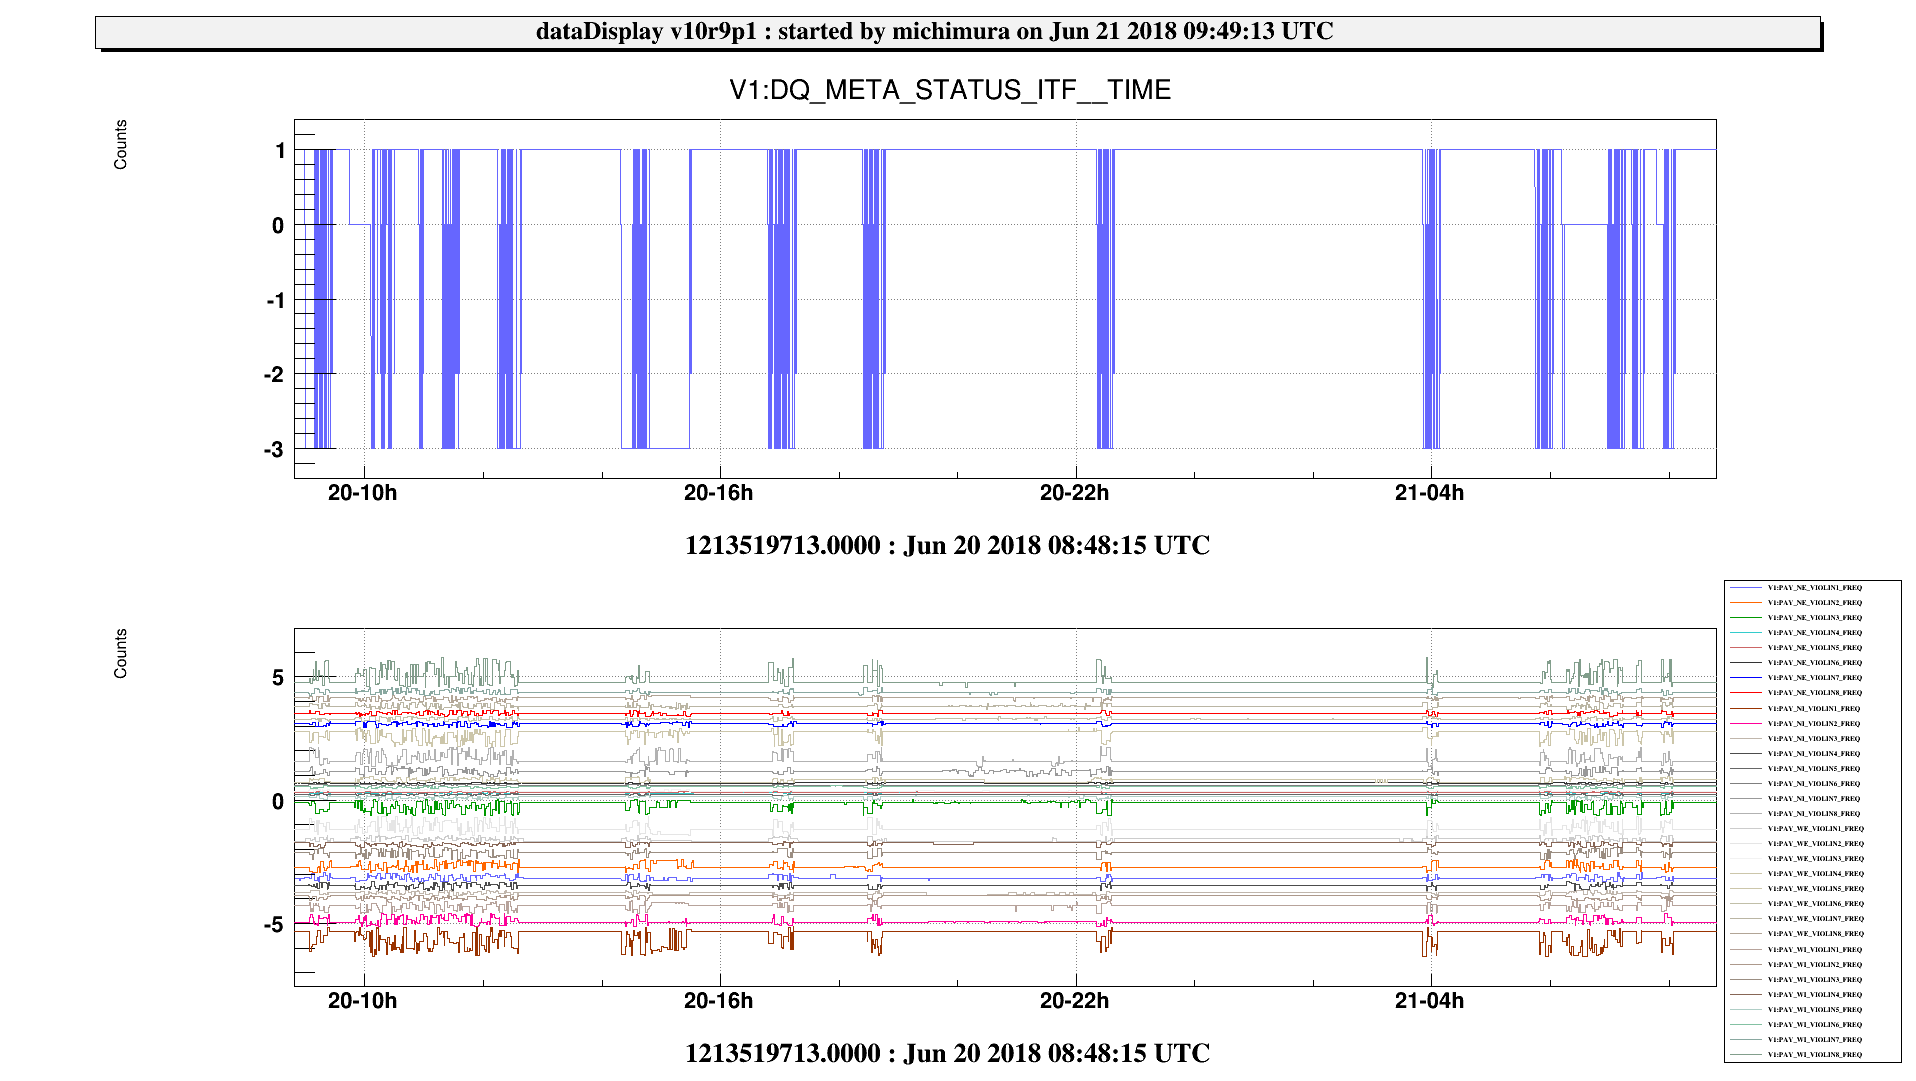
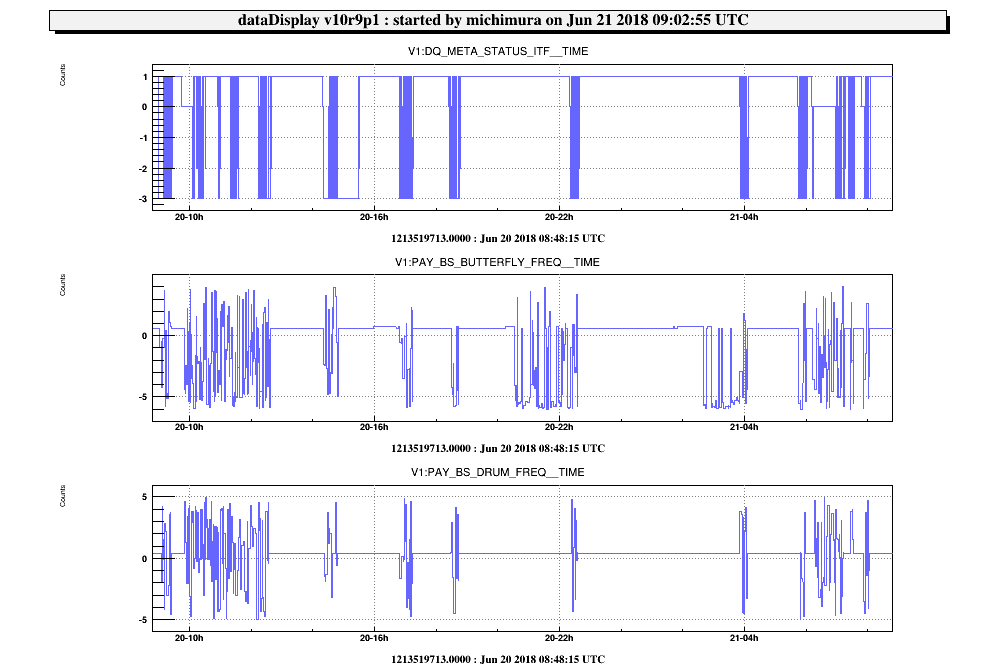
We had a quick look at the line tracker outputs, and confirmed that it is working well.
We found that DRUM1 and DRUM2 modes (likely to be of NI and WI) and BS DRUM and BUTTERFLY modes are kicked during the lock acquisition.
We also found that NE ring heater temperature changes by ~0.1 K between the locks.
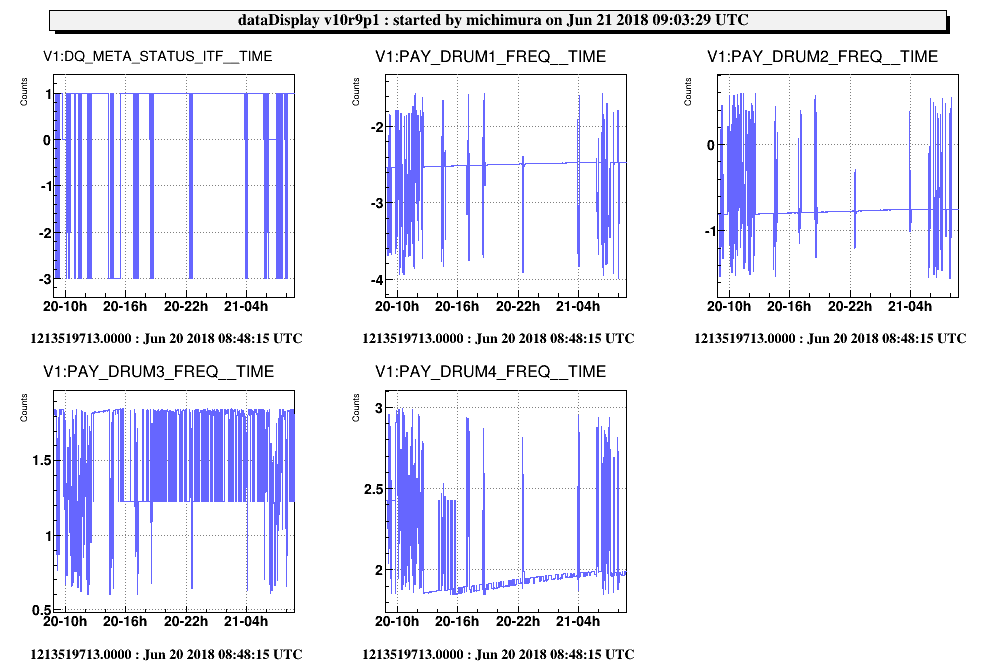
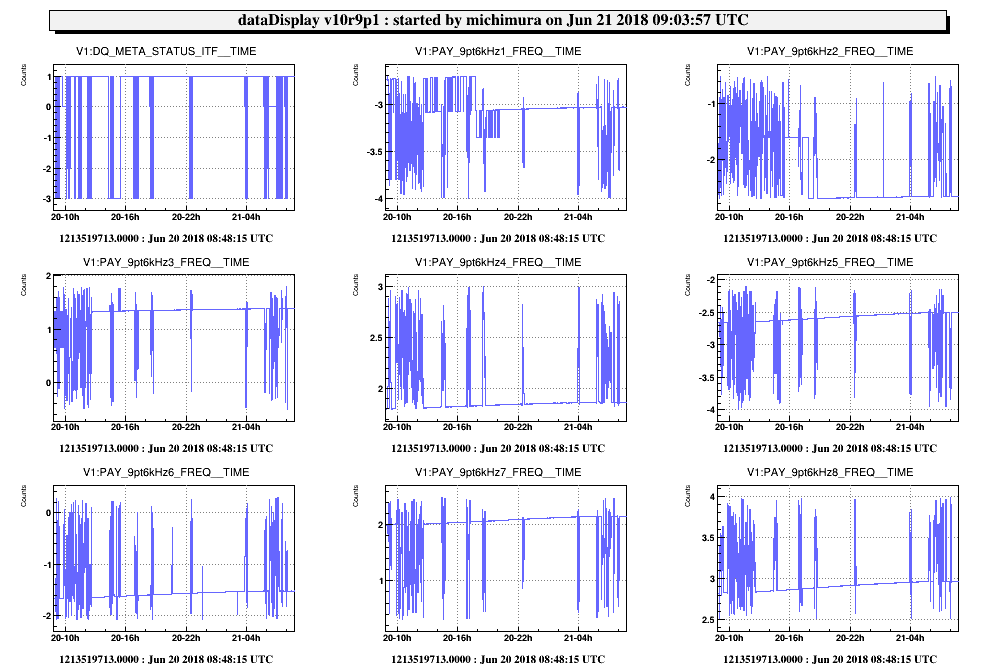
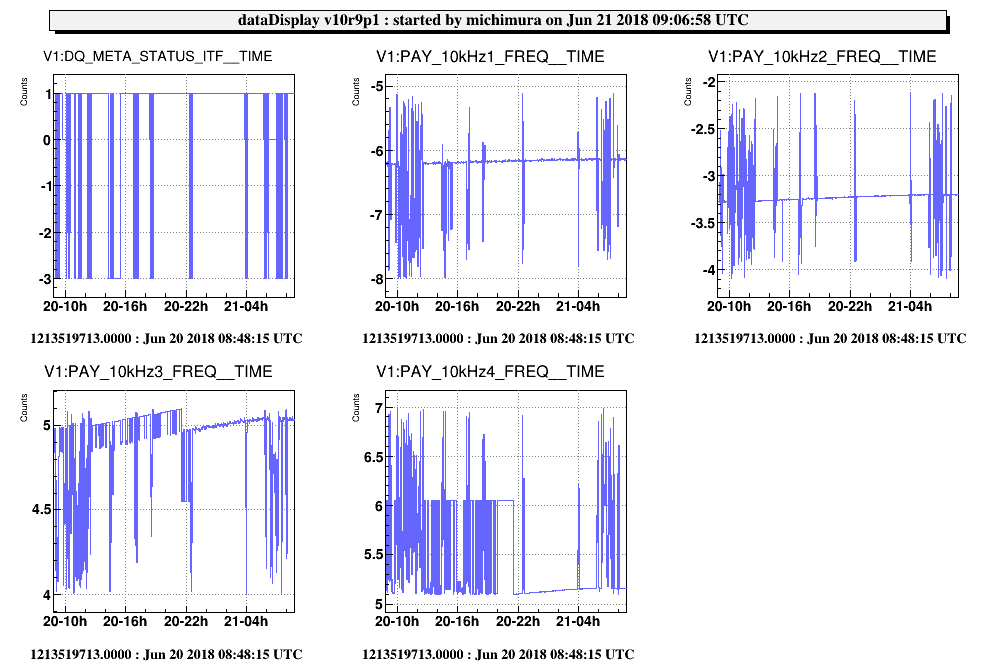
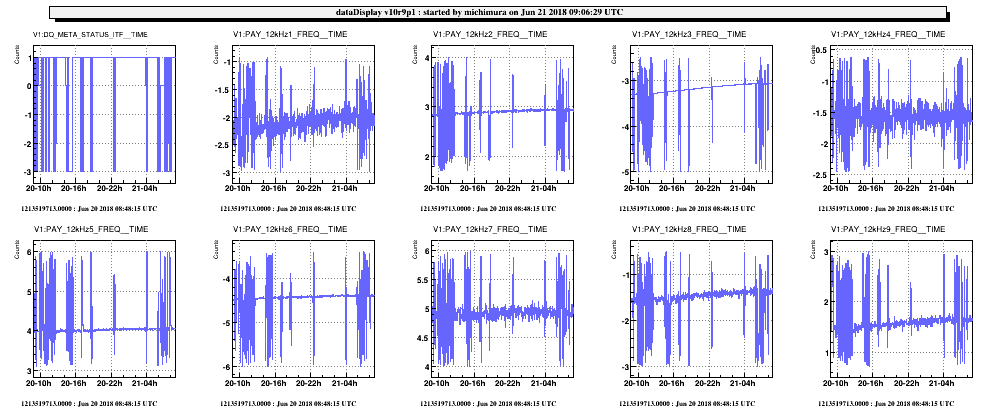
Line tracker frequency outputs:
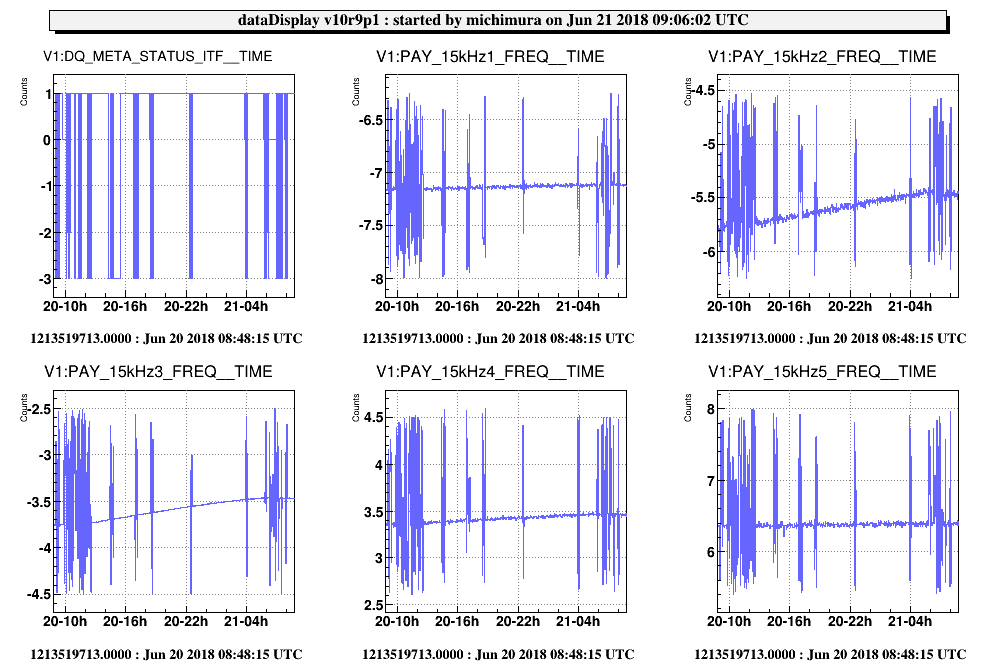
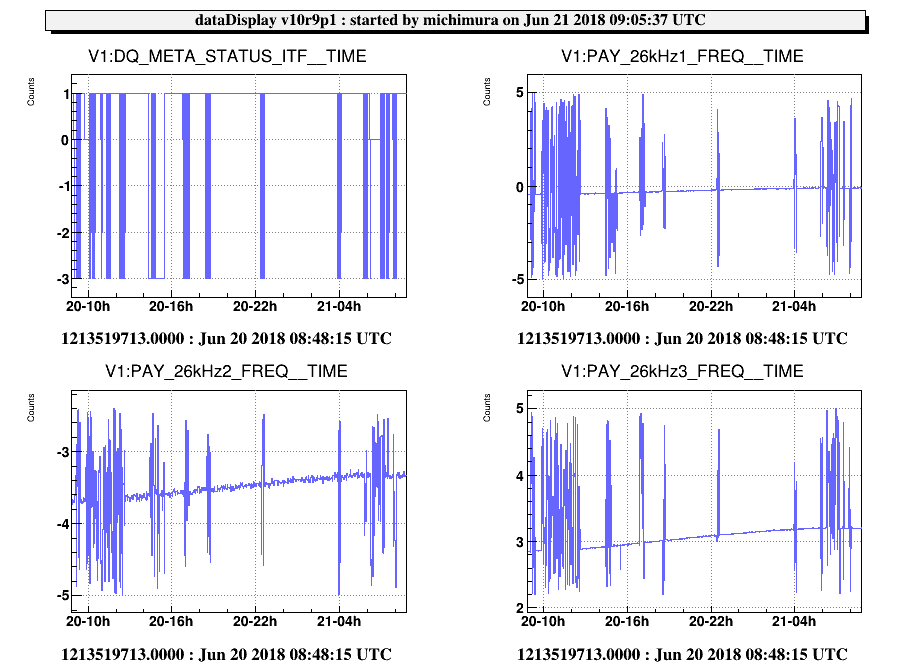
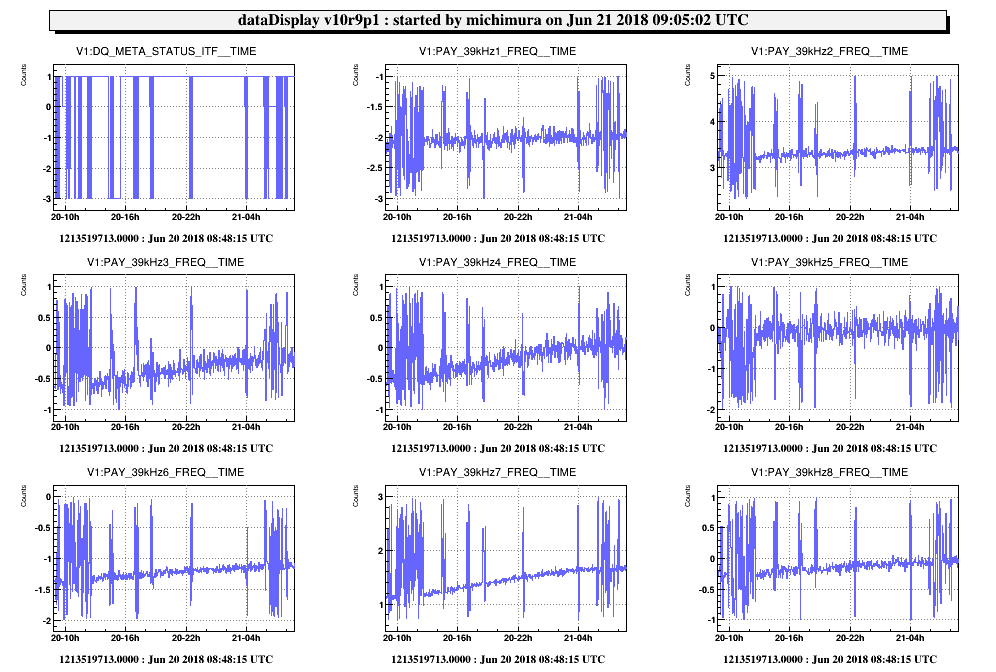
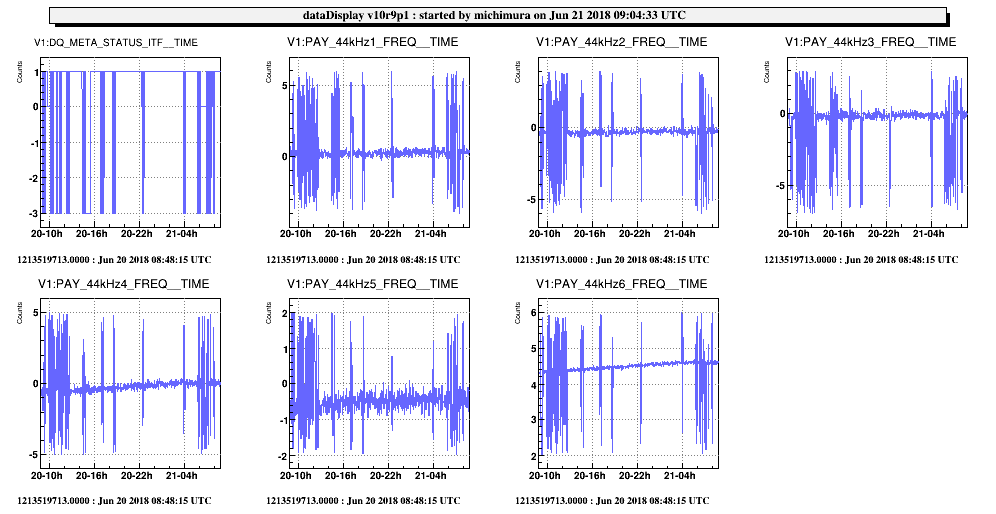
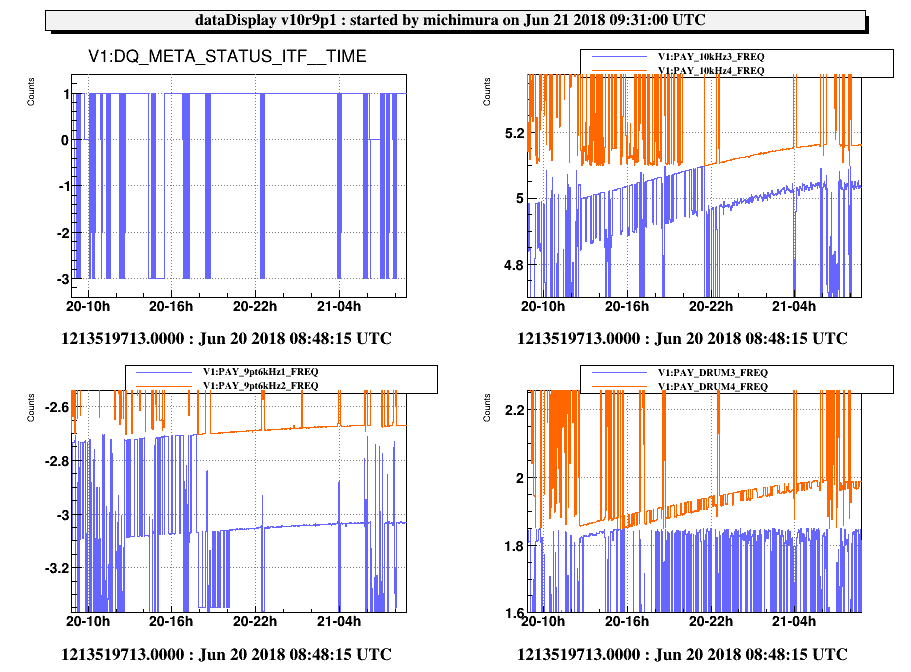
Frequency outputs from yesterday are attached. Some of them are noisy and they are maybe not from the mirror modes.
V1:PAY_{MIR}_VIOLIN#_FREQ (Good)
V1:PAY_BS_BUTTERFLY/DRUM_FREQ (Good)
V1:PAY_DRUM#_FREQ (3 at 7808.8Hz and 4 at 7808.9 Hz are too close and some times following two lines)
V1:PAY_9pt6kHz#_FREQ (1 at 9665.1 Hz and 2 at 9965.4 Hz are too close)
V1:PAY_10kHz#_FREQ (3 at 10112.0 Hz and 4 at 10112.2 Hz are too close)
V1:PAY_12kHz#_FREQ (some of them are noisy)
V1:PAY_15kHz#_FREQ (Good)
V1:PAY_26kHz#_FREQ (Good)
V1:PAY_39kHz#_FREQ (some of them are noisy)
V1:PAY_44kHz#_FREQ (some of them are noisy)
Some of DRUMs, 9pt6kHzs and 10kHzs have modes which are very close in frequency (see figures in logbook #41794), and the line tracker sometimes follows two peaks in the peak search range (see this figure).
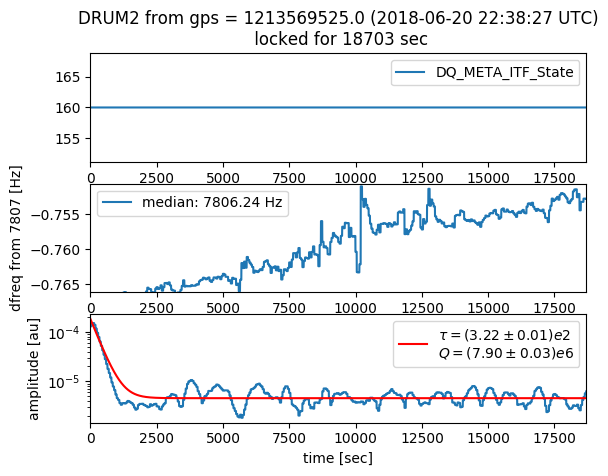
Ring downs from lock acquisition and Q measurement:
Amplitude outputs of the line tracker are basicaly stable during the lock, but DRUM1 and DRUM2 modes and BS DRUM and BUTTERFLY modes have ringdowns during the lock. It looks like they are kicked during the lock acquisition.
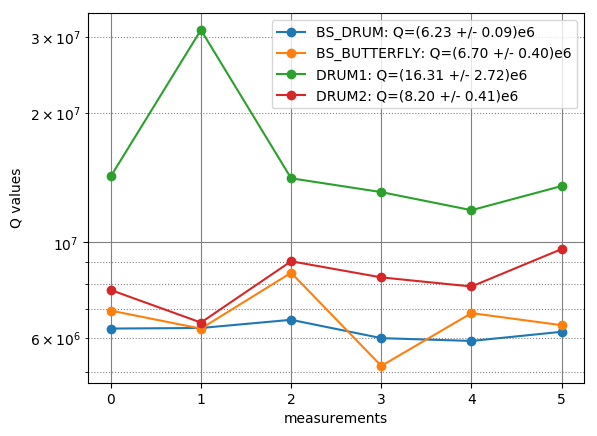
We used this kick to derive the Q-values of the bulk modes. Using the 5 locks stretched for more than 1 hour of LOW_NOISE3 state in June 20, I got the following Q-values.
[BS]
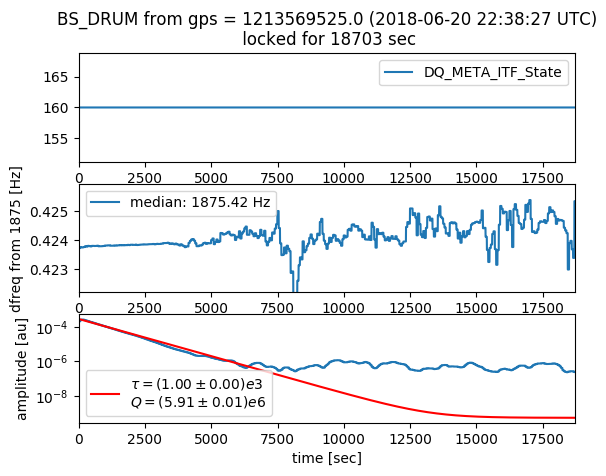
DRUM (1875.5 Hz): (6.2 +/- 0.1)e6 figure
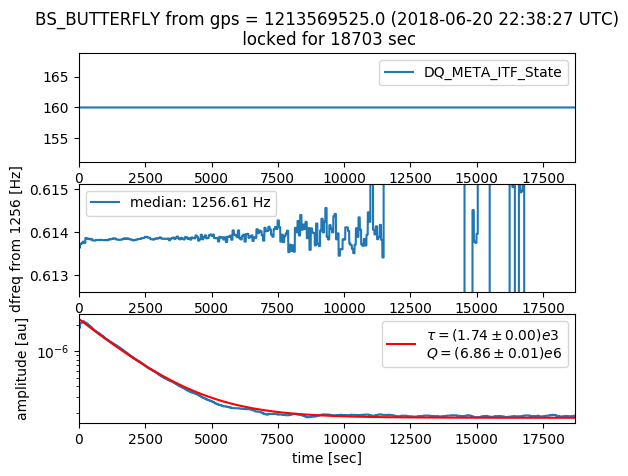
BUTTERFLY (1256.5 Hz): (6.7 +/- 0.4)e6 figure
[Test masses]
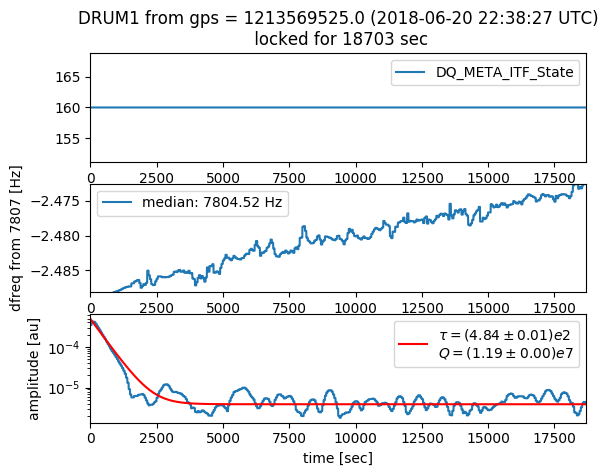
DRUM1 (7804.5 Hz): (1.6 +/- 0.3)e7 figure
DRUM2 (7807.5 Hz): (8.2 +/- 0.4)e6 figure
Attached figures are the typical time series data for each mode used in the analysis. Variation between the measurements are also attached.
I used A*exp(-t/tau)+C for the fitting, and calculated Q-value using Q=pi*f0*tau, where f0 is the measured mode frequency (median of the line tracker frequency output during the lock).
The results look reasonable. See, also, measurements done using O2 data (VIR-0241A-18). They got Q>=2e6 from Lorentian fit of thermal peaks, and ~1e7 from ringdowns for test mass drum modes.
We note that there are some peaks which are not stable and also does not show clear ringdowns (for example, 44kHz1 often rings up and 44kHz2 often goes up and down).
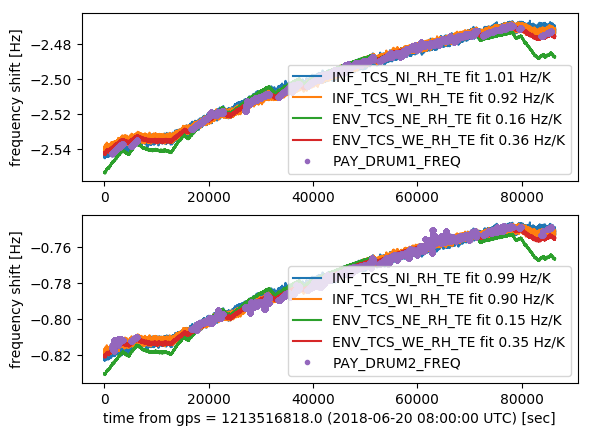
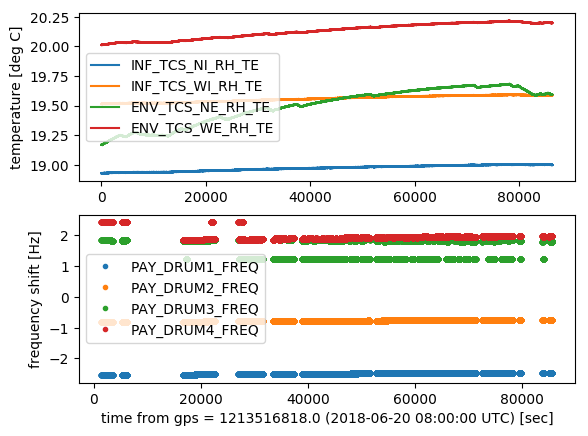
Temperature dependence of drum modes:
We know that one of DRUM3 and DRUM4 is from WE from the drastic temperature change in WE (logbook #41794). We compared DRUM1/2 frequencies and ring heater temperatures, and found they both change along with the temperature change in NI and WI, but not NE and WE (see this figure; similar plot also in logbook #39767). NI and WI have a similar temperature change, so we cannot tell which is which at this point.
From the linear fit, mode frequency dependence on the temperature was derived to be 0.9 to 1.0 Hz/K, which is consistent with previous measurements (logbook #39039 and #41798).
Raw time series data used for the fit is also attached.
We noticed that NE ring heater temperature changes by ~0.1 K between the locks. Not as drastical as NE, but WE ring heater temperature also changes much, compared with WI and NI. This might indicate some scattering, point absorbers, cavity misalignment, etc.
Further investigations such as correlation between different temeprature sensors, alignment drift, etc is necessary.
Next:
- Fit violin ringdowns and get Q-values (when violin damping is off !); we might see the effect from the ear damage?
- Excitation tests to test if we can excite the bulk modes, identify which peaks belong to which mirrors, and measure Q-values.
- Ring heater tests to identify the peaks, measure mode frequency temperature change, and measure the RoC change from transverse mode spacing measurement.
- Look into NE (and WE) temperature change between the locks.
- Look into the cause of the kicks during the lock acquisition.
- Look into the peaks that are not very stable (and doesn't seem to be from the bulk modes)


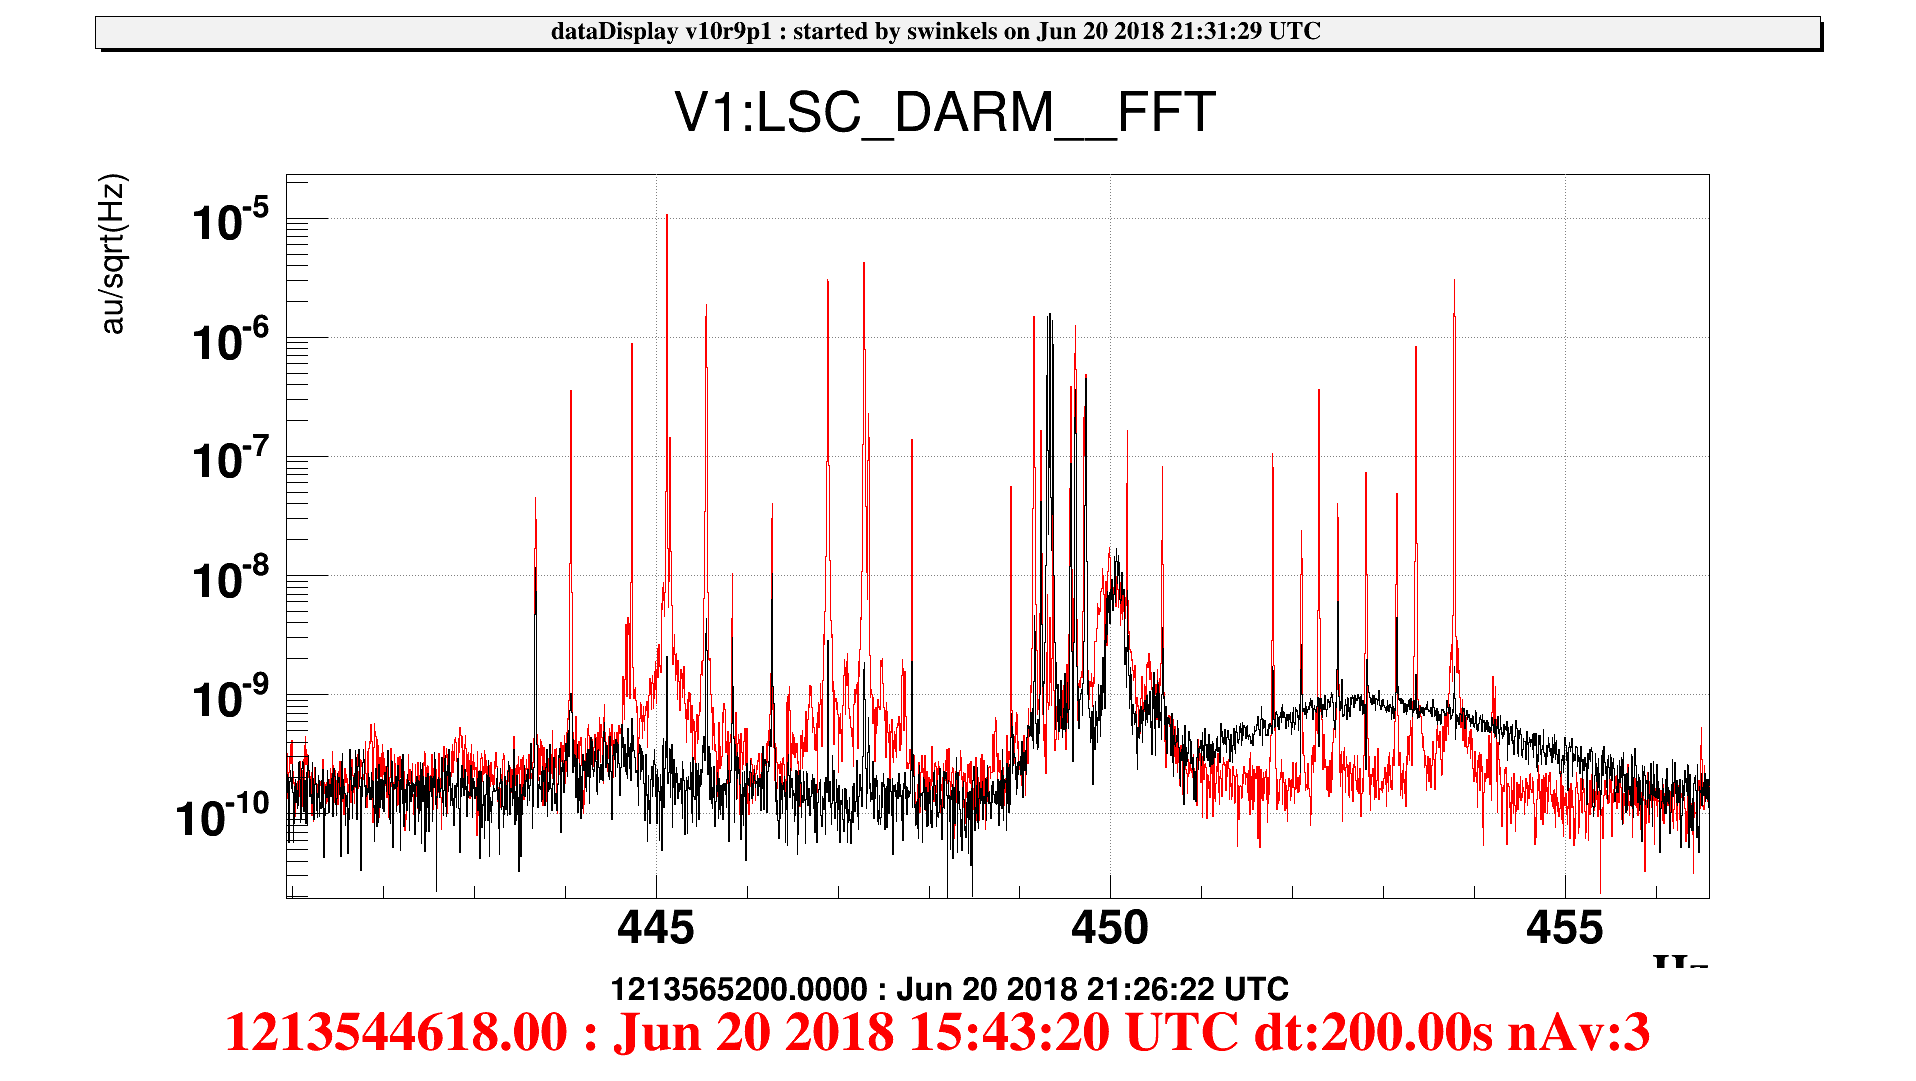
Summary: Tonight we successfully implemented active violin mode damping. We demonstrated damping of modes on all test masses by length actuation on the marionettas. Modes that are isolated in frequency are easily damped into the noise floor. We had trouble with modes close together in frequency and on the same mirror, as expected; specifically around 449.3 Hz.
- - - - - - - -
Damping scheme
The damping scheme and associated channels are shown visually here. It goes as follows:
- take in DARM as error signal
- a BP filter is applied around violin mode: bandpass is 4th order buttorworth, ~200 mHz wide. There are two BP filters to chose from. Filter 1 is centered on measured violin frequency, Filter 2 is shifted by ~60 degrees
- apply gain to mode path
- all mode paths belonging to one mirror are summed together to create a mirror-specific correction signal
- correction signal is sent to either pitch or length of the marionetta
Damping notes
Gains and filters and drives that effectively damped are here. Times that damping started to occur are also there, in case anyone wants to look at data. All modes that are frequency-separated from other modes on same mirror were easily damped into the noise floor.
Ringdown activity here. Full before/after spectrum here. Bandpass coverage here. Note: we don't know what that broad bump in the spectrum is, but it's been there all night and we don't think its associated with our activity.
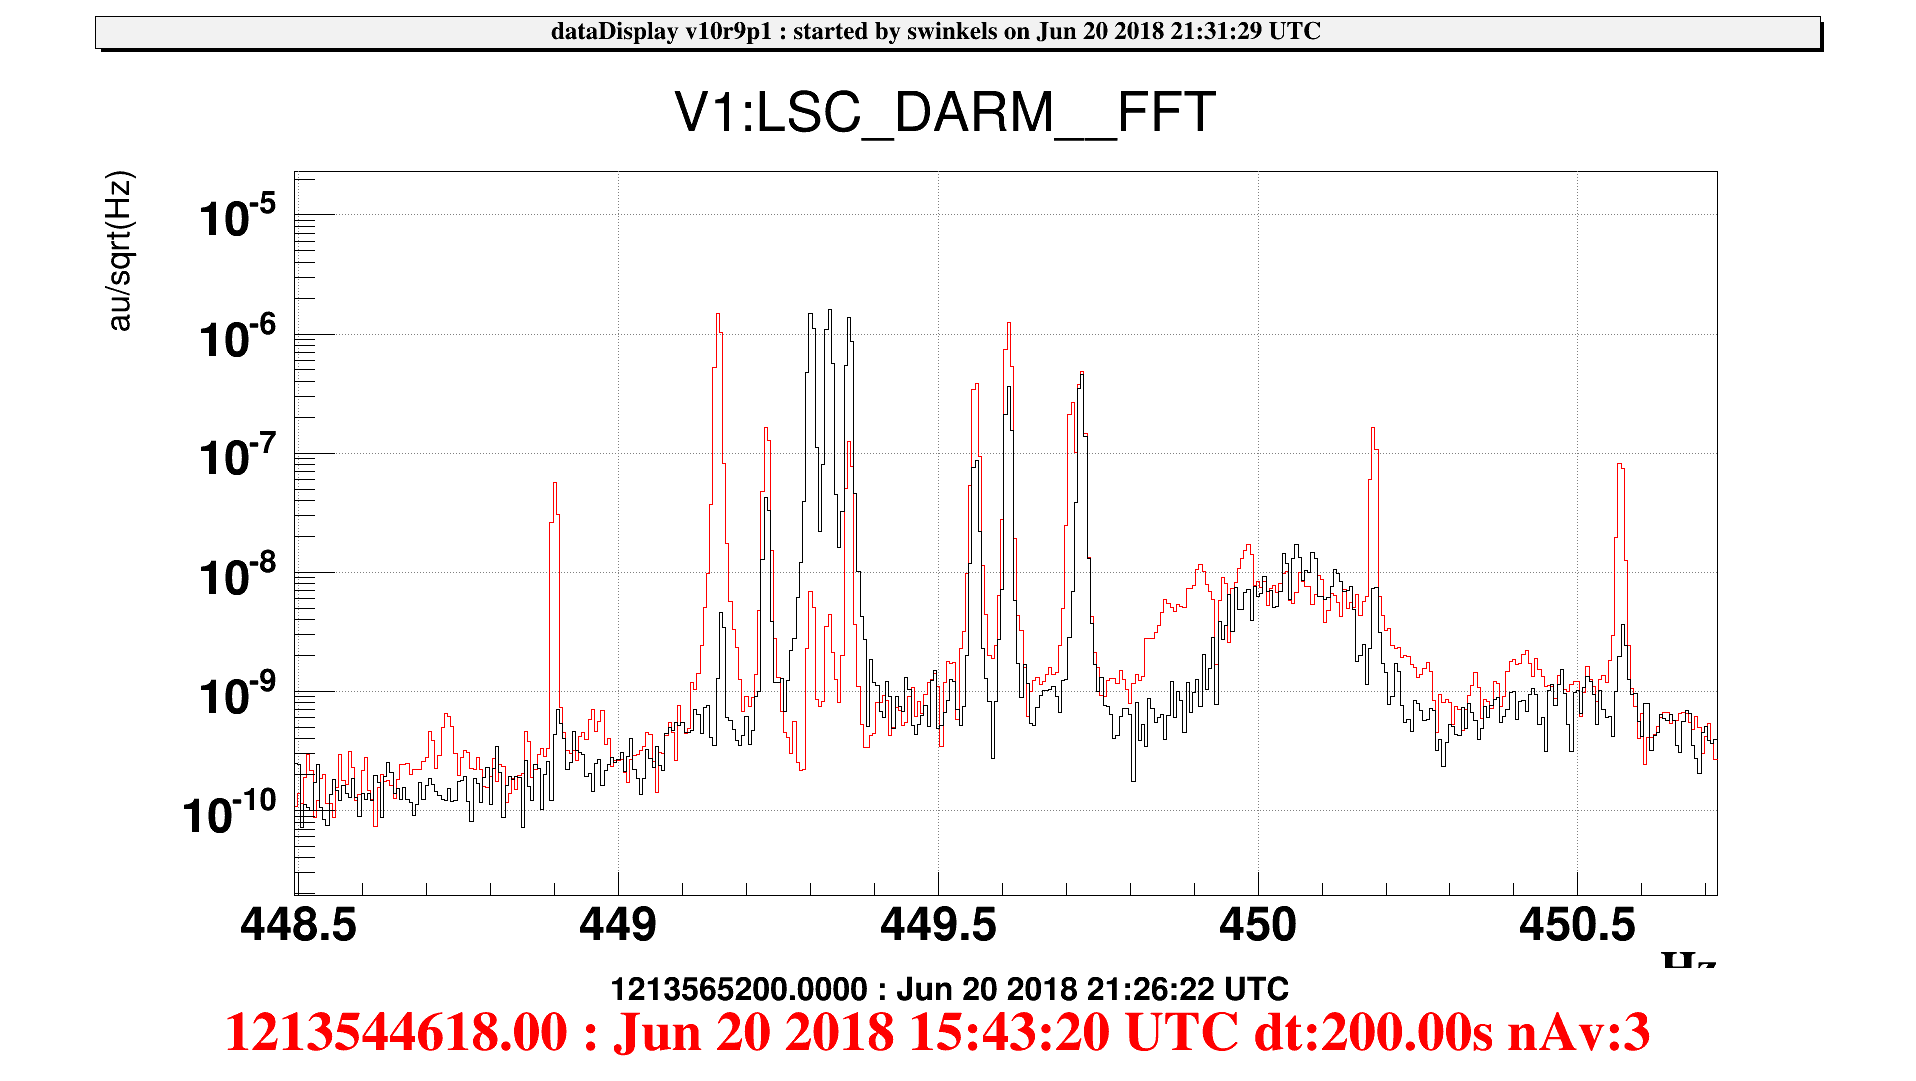
Only trouble modes are around 449.3 Hz. NE has modes at 449.30 and 449.33 Hz, making the sensing and independent damping difficult. We rang them up quite a bit before getting a setting that somewhat turned them around; they will need more work. Zoom in of spectrum around the modes here. Zoom of bandpass coverage mess here.
RMS channels are best indicators of damping/growing, but other nearby high modes can bleed in.
GUI
Yuta made an awesome GUI for violin mode damping, shown here!
For everything you can:
- turn on/off a master switch. This is turned off by Metatron in the DOWN state, requires manual turn on (has 10 second ramp). In this way you can keep known good filters and gains set and eventually this can be turned on via Metatron.
For each mirror you can:
- turn off the output
- toggle between length/pitch marionetta drive
- open relevant dataDisplay screens, which will start automatically.
For each mode you can:
- get the current gain (wait time >5 sec)
- set the gain
- toggle between filter 1 & 2
- emergency stop sending any signal along that mode path
GUI and associated config files are found in /virgoDev/Automation/scripts/LSC/ViolinDamping/violingui.py. It can be opened for all mirrors ( >>python violingui.py ) and also for one mirror, input as an argument ( >>python violingui.py NE )
Other stuff
Violin damping infrustructure is in LSC_Acl.cfg, filters in LSC_Filters.cfg. Note: we hijacked ASC_{mirror}_TX/TY_NOISE_OUT channels to send to DSP for now. This will be cleaned up some, matrix options for drive, etc.
Average elapsed time of LSC_Acl increased form 12.8 to 16.6 us with all added filters, etc. We plan to next optimize some filters, etc., to bring this down.


We've found filters and gains that damp all modes. All violin mode (1st harmonics) are damped to under 2e-21 in strain, shown in Hrec here (and zoomed here).
Since gain values may need to be changed, we've keep the config default values as zero; the working values are stored in the GUI code. After a recompile, you can press "SET ALL gains" to reset to these values. The current working settings are also attached here. We note that only WI requires 60 deg phase correction (use filter 2). We haven't checked to see if all WI modes damp better with this.
At max, we are driving 0.02 V per correction signal.
/virgoApp/violinUI/v1r1
This version has also been added under the IceWM menu SUS section and all declinations of the GUI can be started from there (Fig. 1)

I made a PyQt version of GUI for violing damping.
Previously, the GUI was made with Python Tkinter and current values are acquired using AclParamGet commants.
PyQt version uses ConnectOnline function to continuously get the current values (see logbook #42150 and comments).
PyQt version has almost the same functionality as before, but better since you can monitor the current values live and easier to understand the signal flow.
To save which filters are used and to save whether TX or TY is used, I added the following lines to LSC_SMS.cfg (this is the reason I had to restart LSC Acl; see logbook #42298).ACL_SMS "LSC_" NI_VIOLIN1_ERR NI_VIOLIN2_ERR NI_VIOLIN3_ERR NI_VIOLIN4_ERR NI_VIOLIN5_ERR NI_VIOLIN6_ERR NI_VIOLIN7_ERR NI_VIOLIN8_ERR
ACL_SMS "LSC_" NE_VIOLIN1_ERR NE_VIOLIN2_ERR NE_VIOLIN3_ERR NE_VIOLIN4_ERR NE_VIOLIN5_ERR NE_VIOLIN6_ERR NE_VIOLIN7_ERR NE_VIOLIN8_ERR
ACL_SMS "LSC_" WI_VIOLIN1_ERR WI_VIOLIN2_ERR WI_VIOLIN3_ERR WI_VIOLIN4_ERR WI_VIOLIN5_ERR WI_VIOLIN6_ERR WI_VIOLIN7_ERR WI_VIOLIN8_ERR
ACL_SMS "LSC_" WE_VIOLIN1_ERR WE_VIOLIN2_ERR WE_VIOLIN3_ERR WE_VIOLIN4_ERR WE_VIOLIN5_ERR WE_VIOLIN6_ERR WE_VIOLIN7_ERR WE_VIOLIN8_ERR
ACL_SMS "LSC_" ASC_NI_TX_NOISE_CORR ASC_NE_TX_NOISE_CORR ASC_WI_TX_NOISE_CORR ASC_WE_TX_NOISE_CORR
ACL_SMS "LSC_" ASC_NI_TY_NOISE_CORR ASC_NE_TY_NOISE_CORR ASC_WI_TY_NOISE_CORR ASC_WE_TY_NOISE_CORR
"Restore Defaults" button on the top right will restore saved values of GAINs and filters and applies them.
Attached figure shows the current default GAINs and filters which were used in June 22 (at 13W; logbook #41949).

The coupling of 54 Hz changes, but when it is elevated it shows clear correlation with the top of the hour. I show 50.5 - 55 Hz DARM over longer time and shorter (to see exact hour jumps), compared with another band in DARM to show it's just this peak. Again, I've compared time correlation with all ENV seis, mic, and acc and find nothing. We could use some help from DetChar on this, running slow correlation or looking through temperature control (air conditioner, etc) channels, etc.


I've had a second look, including at the NI kick time (~June 5 20:00 UTC) and I attach an updated, more sure violin mode list. The only changes were to input modes. Yuta has updated the line tracker code accordingly.
Additional note to logbook #41883 (I posted twice, sorry)
The edge frequencies (boundary frequencies) to search for the peak are basically placed at the center of the neibouring line frequencies, but if the neibouring line frequencies are too far from each other, the edges are placed 1 Hz away from the measured line frequency. 1 Hz should be large enough to track the mode frequency shifts during the ring heater test (logbook #39679 gives ~0.1 Hz drum mode frequency shift with ~0.5 deg ring heater temperature rise), and should be small enough to avoid tracking other peaks (see attached figures in logbook #41794).
We have fixed some bugs in the line tracker code associated with multiple demodulation frequencies and added more modes to track.
We hsve also changed the channel to demodulate from 20 kHz sampled SDB2_B1_PDA2_Audio to 100 kHz sampled SDB2_B1_PDA2_Audio_100k to track bulk modes at higher frequencies.
The code lives in /virgoDev/Automation/PyALP/PySpectral/algo.py
The edge frequencies (boundary frequencies) to search for the peak are basically placed at the center of the neibouring line frequencies, but if the neibouring line frequencies are too far from each other, the edges are placed 1 Hz away from the measured line frequency. 1 Hz should be large enough to track the mode frequency shifts during the ring heater test (logbook #39679 gives ~0.1 Hz drum mode frequency shift with ~0.5 deg ring heater temperature rise), and should be small enough to avoid tracking other peaks (see attached figures in logbook #41794).
Attached are the full list of channels added, their demodulation frequencies and measured line frequencies (logbook #41842, #41794, #41807, #41815).
There are 83 lines tracked in total now
V1:PAY_{MIR}_VIOLIN# (XX are the ones we are not sure)

	V1:PAY_BS_BUTTERFLY

	V1:PAY_BS_DRUM

	V1:PAY_DRUM#

	V1:PAY_9pt6kHz#

	V1:PAY_10kHz#

	V1:PAY_12kHz#

	V1:PAY_15kHz#

	V1:PAY_26kHz#

	V1:PAY_39kHz#

	V1:PAY_44kHz#
We have fixed some bugs in the line tracker code associated with multiple demodulation frequencies and added more modes to track.
We hsve also changed the channel to demodulate from 20 kHz sampled SDB2_B1_PDA2_Audio to 100 kHz sampled SDB2_B1_PDA2_Audio_100k to track bulk modes at higher frequencies.
The code lives in /virgoDev/Automation/PyALP/PySpectral/algo.py
Attached are the full list of channels added, their demodulation frequencies and measured line frequencies (logbook #41842, #41794, #41807, #41815).
There are 83 lines tracked in total nowV1:PAY_{MIR}_VIOLIN# (XX are the ones we are not sure)
V1:PAY_BS_BUTTERFLY
V1:PAY_BS_DRUM
V1:PAY_DRUM#
V1:PAY_9pt6kHz#
V1:PAY_10kHz#
V1:PAY_12kHz#
V1:PAY_15kHz#
V1:PAY_26kHz#
V1:PAY_39kHz#
V1:PAY_44kHz#
We had a quick look at the line tracker outputs, and confirmed that it is working well.
We found that DRUM1 and DRUM2 modes (likely to be of NI and WI) and BS DRUM and BUTTERFLY modes are kicked during the lock acquisition.
We also found that NE ring heater temperature changes by ~0.1 K between the locks.
Line tracker frequency outputs:
Frequency outputs from yesterday are attached. Some of them are noisy and they are maybe not from the mirror modes.
V1:PAY_{MIR}_VIOLIN#_FREQ (Good)
V1:PAY_BS_BUTTERFLY/DRUM_FREQ (Good)
V1:PAY_DRUM#_FREQ (3 at 7808.8Hz and 4 at 7808.9 Hz are too close and some times following two lines)
V1:PAY_9pt6kHz#_FREQ (1 at 9665.1 Hz and 2 at 9965.4 Hz are too close)
V1:PAY_10kHz#_FREQ (3 at 10112.0 Hz and 4 at 10112.2 Hz are too close)
V1:PAY_12kHz#_FREQ (some of them are noisy)
V1:PAY_15kHz#_FREQ (Good)
V1:PAY_26kHz#_FREQ (Good)
V1:PAY_39kHz#_FREQ (some of them are noisy)
V1:PAY_44kHz#_FREQ (some of them are noisy)
Some of DRUMs, 9pt6kHzs and 10kHzs have modes which are very close in frequency (see figures in logbook #41794), and the line tracker sometimes follows two peaks in the peak search range (see this figure).
Ring downs from lock acquisition and Q measurement:
Amplitude outputs of the line tracker are basicaly stable during the lock, but DRUM1 and DRUM2 modes and BS DRUM and BUTTERFLY modes have ringdowns during the lock. It looks like they are kicked during the lock acquisition.
We used this kick to derive the Q-values of the bulk modes. Using the 5 locks stretched for more than 1 hour of LOW_NOISE3 state in June 20, I got the following Q-values.
[BS]
DRUM (1875.5 Hz): (6.2 +/- 0.1)e6 figure
BUTTERFLY (1256.5 Hz): (6.7 +/- 0.4)e6 figure
[Test masses]
DRUM1 (7804.5 Hz): (1.6 +/- 0.3)e7 figure
DRUM2 (7807.5 Hz): (8.2 +/- 0.4)e6 figure
Attached figures are the typical time series data for each mode used in the analysis. Variation between the measurements are also attached.
I used A*exp(-t/tau)+C for the fitting, and calculated Q-value using Q=pi*f0*tau, where f0 is the measured mode frequency (median of the line tracker frequency output during the lock).
The results look reasonable. See, also, measurements done using O2 data (VIR-0241A-18). They got Q>=2e6 from Lorentian fit of thermal peaks, and ~1e7 from ringdowns for test mass drum modes.
We note that there are some peaks which are not stable and also does not show clear ringdowns (for example, 44kHz1 often rings up and 44kHz2 often goes up and down).
Temperature dependence of drum modes:
We know that one of DRUM3 and DRUM4 is from WE from the drastic temperature change in WE (logbook #41794). We compared DRUM1/2 frequencies and ring heater temperatures, and found they both change along with the temperature change in NI and WI, but not NE and WE (see this figure; similar plot also in logbook #39767). NI and WI have a similar temperature change, so we cannot tell which is which at this point.
From the linear fit, mode frequency dependence on the temperature was derived to be 0.9 to 1.0 Hz/K, which is consistent with previous measurements (logbook #39039 and #41798).
Raw time series data used for the fit is also attached.
We noticed that NE ring heater temperature changes by ~0.1 K between the locks. Not as drastical as NE, but WE ring heater temperature also changes much, compared with WI and NI. This might indicate some scattering, point absorbers, cavity misalignment, etc.
Further investigations such as correlation between different temeprature sensors, alignment drift, etc is necessary.
Next:
- Fit violin ringdowns and get Q-values (when violin damping is off !); we might see the effect from the ear damage?
- Excitation tests to test if we can excite the bulk modes, identify which peaks belong to which mirrors, and measure Q-values.
- Ring heater tests to identify the peaks, measure mode frequency temperature change, and measure the RoC change from transverse mode spacing measurement.
- Look into NE (and WE) temperature change between the locks.
- Look into the cause of the kicks during the lock acquisition.
- Look into the peaks that are not very stable (and doesn't seem to be from the bulk modes)
As noted previously, the NE ring heater temperature sensors see larger temperature changes with lock/locklosses. To check if this is just a RH TE calibration error, I looked at the vertical drift (the blade springs sag or stiffen with temperature and thus are a best true change-of-temperature sensor). Daily ambient temperatures dominate, so I roughly subtracted this by finding lockloss during a mostly linear vertical drift time and detrending linearly. The residual confirms what the ring heater temp sensors see: NE tower sees ~2x temperature change compared to WE during lock/lockloss. The attached plot shows the end ring heater temp sensors, the linear fit on the raw vertical data (I use vertical sensors above the marionetta and in payload chamber), and the detrended vertical data. I looked also since the power increase, but we've had few locks; it looks comparable now at 25W but the ambient temp looks less linear in the lock times, making simple linear detrend less reliable. Should be investigated more with cleaner data/better subtraction. Script is in /users/hardwick/scripts/mirror_temp.py. Just need to change time and duration.
I also looked again at the west end during the large temp change when the air conditioning went off; shown here. We can roughly calibrate: 0.36 RH degC / 1 WEB degC and 235 um Vert / 1 WEB degC. Note this doesnt take into account the lock which held for the beginning part of the large ambient temp change.
A large peak at 54 Hz has appeared in DARM; it was not large the morning of Wed June 6th or anytime before, shows up fully on Thursday and has remained since. (We locked very briefly Wed and the peak can be seen but is not very high). It seems due to some change occuring on Wednesday. There was a new chiller turned on Tuesday for a test, but was turned back off as evidenced by the accelerometer close by. There was cabling change of PD for IMC. I have looked through most accelerometer, seis, and mic channels and do not see evidence of anything mechanical turned on during this time.


The coupling of 54 Hz changes, but when it is elevated it shows clear correlation with the top of the hour. I show 50.5 - 55 Hz DARM over longer time and shorter (to see exact hour jumps), compared with another band in DARM to show it's just this peak. Again, I've compared time correlation with all ENV seis, mic, and acc and find nothing. We could use some help from DetChar on this, running slow correlation or looking through temperature control (air conditioner, etc) channels, etc.
Bas noticed that the 54Hz non stationary behavior is correlated with lines of the forest (Figure 1). Also we observe that the 54Hz line is seen (but poorly coherent) in PRCL and MICH (figure 2).
To test the hypothesis that this line is linked with the timing, this morning we used a fan blowing onto the GPS receiver board to temporarely cool it down. We run the fan from 8:11 to 8:18 UTC.
This was very effecting in moving all the forest (Figure 3).
We see there is some residual of timing lines in hrec which survive the subtraction, particulrly the 380Hz (Figure 4).
During the thermal transient we can see the 54 Hz line changing its amplitude while a bunch of 1-Hz spaced lines crossed it as if this 54Hz line is beating with the timing lines (Figure 5).


Bas noticed that the 54Hz not stationary behavior is correlated with lines of the forest (Figure 1). Also we observe that the 54Hz line is seen (but poorly coherent) in PRCL and MICH (Figure 2).
To test the hypothesis that this line is linked with the timing, this morning we used a fan blowing onto the GPS receiver board to temporarely cool it down. We run the fan from 8:11 to 8:18 UTC.
This was very effective in moving the whole forest (Figure 3).
There is some residual of timing lines in hrec which survive the subtraction, particulrly around 380Hz (Figure 4).
During the thermal transient we can see the 54 Hz line changing its amplitude while a bunch of 1-Hz spaced lines crossed it, as if the 54Hz line is beating with the timing lines (Figure 5).
In prep for the upcoming violin mode damping fun, I've used the times given above to identify the mirrors belonging to first order modes. I attach a text file with frequencies (question marks indicate peaks I'm uncertain about) and a snapshot of the spectrum at the times above where purple == no excitation, orange == WI, blue == NE, green == WE. NI modes identified in 41712.

We know from entry 38399 that West arm is "more sensitive" to the 50Hz problem associated at motor's crates and cables with respect to North arm.
Moreover we know that when powering mains to WE motor's crates (via remote smart PDUs) the ITF unlock.
We made some investigations:
1) in both locations when switching mains ON through smart PDU we detect a short but quite intense EM spikes (using a battery powered oscilloscope, even when unconnected); this should be due to the way the smart PDU closes contacts to the load (mechanical relay actuation): if the closing action occur while the 50Hz sine is at its maximum (or minimum), there is a current spike propagated in the surrounding area via mains cables acting as antenna.
Clearly the West End terminal is more sensitive in that sense, maybe for the physical location of cables and or electronics. A way to overcome this problem would be the use of some "zero-crossing" solid state switch.
2) searching for a good reason of the 50Hz mains line increase if WI and WE motors crates are switched ON, we had a look at voltage and current flowing into motor's cables (crate ON but no movement sent to the
motors); no trace of 50Hz signal, even at maximum sensitivity (e.g. 10mV or 1mA). We maybe noticed some DC shift on the current reading if the crate is switched ON or OFF, but the value was very low (~200uA), and we have not enough statistics on this (checked only on one motor at WE).
We have also looked at the time constants of various channels to look into SSFS UGF decay after the lock (VIR-0390A-18).
Conclusion:
We should look into 56MHz sideband power decay in PRC after the lock. It could be from BS,CP,POP heating and/or something in the injection system. WI/NI seem to have longer time constant, and may not be the cause.
Details:
Using the 11 locks stretched for more than 1 hour between June 7 to 11, we got the following time constants (some of them fits very badly, so don't believe in the statistical errors too much).
LSC_B1_DC_mean : tau=(-4.77 +/- 7.21)e0 sec
LSC_B1p_DC_mean : tau=(-8.69 +/- 0.68)e2 sec
LSC_B1s1_DC_mean : tau=(-1.11 +/- 0.05)e3 sec
LSC_B2_DC_mean : tau=(-3.51 +/- 0.14)e2 sec
LSC_B4_DC_mean : tau=(-1.69 +/- 0.18)e2 sec
LSC_B5_DC_mean : tau=(-1.59 +/- 0.12)e2 sec
LSC_B7_DC_mean : tau=(-3.92 +/- 0.16)e2 sec
LSC_B8_DC_mean : tau=(-1.38 +/- 0.11)e2 sec
INF_TCS_PR_RH_TE : tau=(1.24 +/- 4.36)e1 sec
INF_TCS_NI_RH_TE : tau=(-2.46 +/- 0.15)e3 sec
INF_TCS_WI_RH_TE : tau=(2.96 +/- 0.36)e3 sec
ENV_TCS_NE_RH_TE : tau=(-1.40 +/- 0.00)e4 sec
ENV_TCS_WE_RH_TE : tau=(5.20 +/- 0.06)e3 sec
LSC_SSFS_UGF : tau=(-1.38 +/- 0.01)e3 sec
LSC_DARM_UGF : tau=(-7.69 +/- 0.05)e0 sec
LSC_B4_56MHz_DPHI : tau=(-1.94 +/- 0.01)e3 sec
LSC_B4_112MHz_MAG_mean : tau=(-1.54 +/- 0.01)e3 sec
SIB2_RFC_PD2_56MHz_I_DS_mean : tau=(-1.29 +/- 0.00)e2 sec
SDB2_B1p_PD2_112MHz_mag_mean : tau=(-1.26 +/- 0.01)e3 sec
DAQ_LNFS_EOM_6MHz_dPhi_100Hz_mean : tau=(-8.95 +/- 0.01)e2 sec
DAQ_LNFS_EOM_8MHz_dPhi_100Hz_mean : tau=(-1.42 +/- 0.00)e3 sec
DAQ_LNFS_EOM_56MHz_dPhi_100Hz_mean : tau=(1.58 +/- 0.28)e2 sec
INJ_IMC_TRA_DC_mean : tau=(-5.70 +/- 0.90)e2 sec
B7_DC/B4_DC : tau=(-6.06 +/- 0.13)e2 sec
B8_DC/B4_DC : tau=(-3.02 +/- 0.13)e3 sec
Attached are the typical time series data for two locks used in our analysis.
We used A*exp(t/tau)+C for the fitting.
The time constant for LSC_SSFS_UGF is consistent with LSC_B4_112MHz_MAG and LSC_B4_56MHz_DPHI, which suggests 56MHz sideband power decaying (or demodulation phase changing) is the cause of the UGF decay (B4_56MHz is used in SSFS). You can also see that SDB2_B1p_PD2_112MHz_mag has consistent time constant. We should monitor the temperature of the BS to look into this sideband power decay (this is one of the reason we added BS drum/butterfly mode tracker; logbook #41815).
Photodiode DC signals, including B4_DC, has shorter time constants, and therefore power recycling gain decay for the carrier is unlikely the cause.
The test mass (ring heater) temperatures have slightly longer time contant and this is somewhat consistent with the time constants for normalized arm transmissions (B7_DC/B4_DC, B8_DC/B4_DC). I believe this is the time constant of the NI/WI etalon effect (logbook #39767). We need a new line tracker working to monitor the real test mass temperatures to confirm this (logbook #41807) after the recovery of the interferometer.
Interestingly, DAQ_LNFS_EOM_(6MHz|8MHz)_dPhi_100Hz (created in June 7?, logbook #41748) have the similar time constant, but 56MHz one does not.


Beamsplitter drum (~1875 Hz) and butterfly (~1256 Hz) now tracked as well as PAY_BS_DRUM/BUTTERFLY_AMPL/FREQ
We've updated Bas's drum mode tracker to the new frequencies (which shifted with the monolithic suspension install). We've also added 9.6 kHz modes.
Channels are:
- V1:PAY_DRUM#_AMPL and V1:PAY_DRUM#_FREQ where # = 1,2,3, or 4 in order of increasing frequency.
- V1:PAY_9pt6kHz#_AMPL and FREQ, where # = 1 - 8
These channels are available on MoniUsers starting 1212850711 (for Drum; 9pt6 came a few minutes later), at which time old channels (TCS_ETALON_XX_DRUM# and _WE_DRUM#) became unavailable.
Code available at /virgoDev/Automation/PyALP/PySpectral/algo.py.

Note (from Mwas on duplicate entry 41799): 'The line at 12.8kHz is not a mirror mode but the OMC1 length PZT dither at 12831.3Hz to get OMC lock signal. There should also be a line at 15569Hz which is the OMC2 length PZT dither.'
I confirm I also found the 15.5 kHz mode. Thank you!
I've used the large temperature change over the past weekend to identify WETM mirror modes.
- - - - - -
Eigenfrequencies of the test masses are proportional to square root of Young's modulus: f ~ E1/2, where E := Young's modulus. The Young's modulus for fused silica has some temperature dependence ( measured to be (dE/dT)/E = 1.52e-4 / K ); as temperature increases, Young's modulus increases, so the mode frequency increases over a lock stretch with self heating, ring heaters, or with a strong ambient temperature increase.
With the accidental temperature change test at WE over the weekend (starting Sunday morning ~1:00 UTC, 41771), we are thus able to identify modes of of the West End mirror by their frequency shifts. The first attachment shows the rise of the room temperature on the top and the subsequent rise of the ring heater temperature sensor on the bottom, the latter lagging by ~6.7 hours.
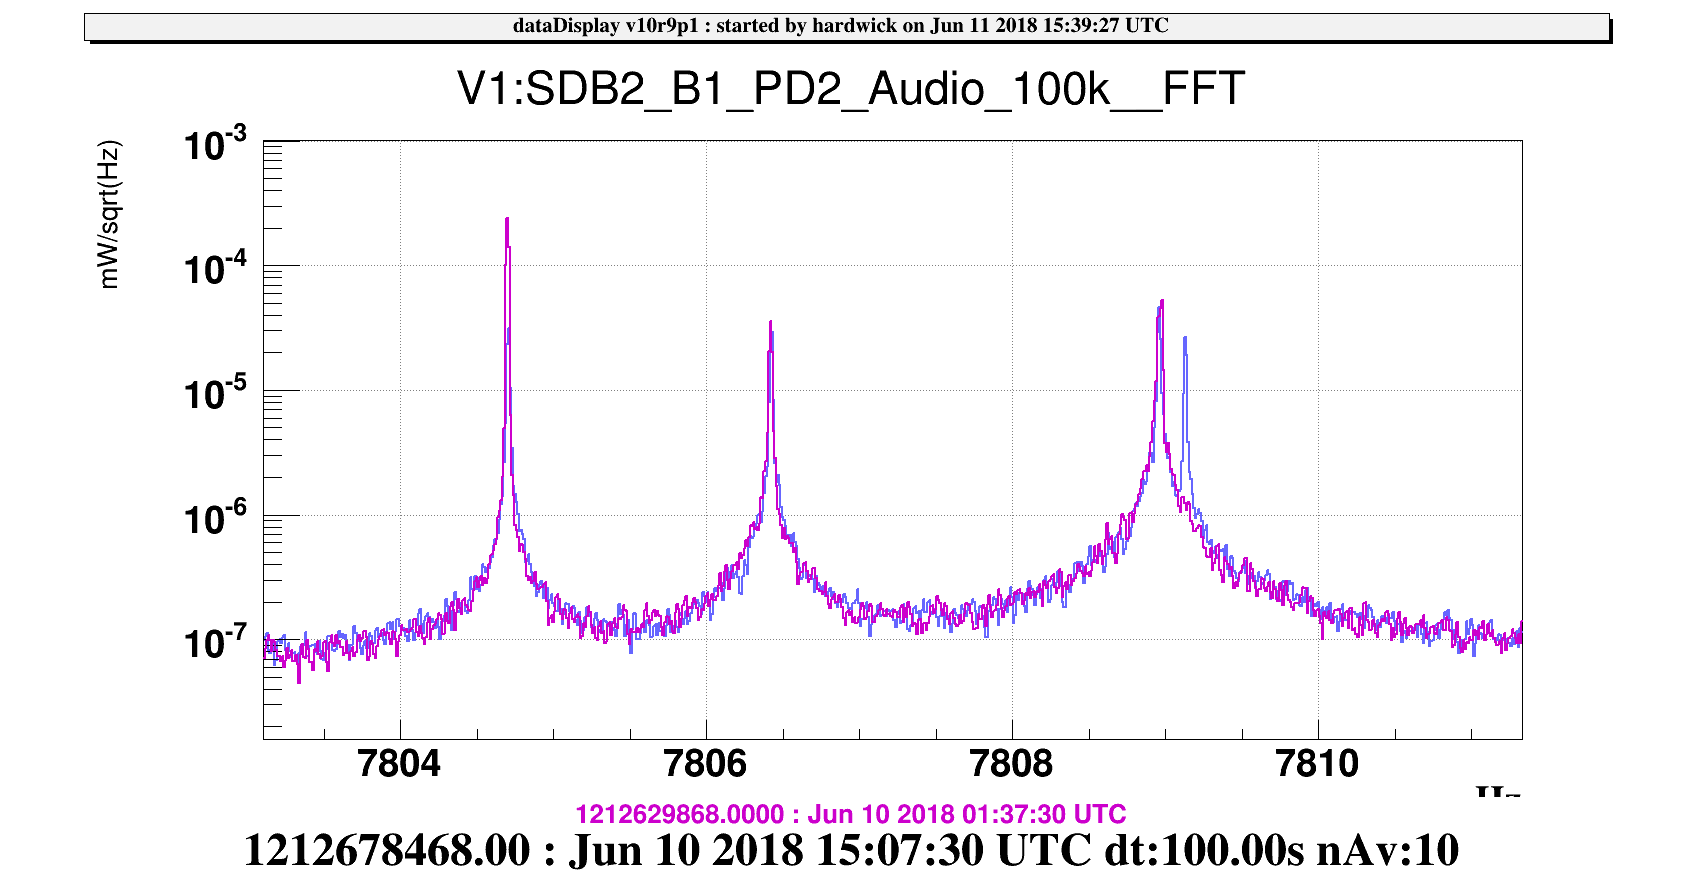
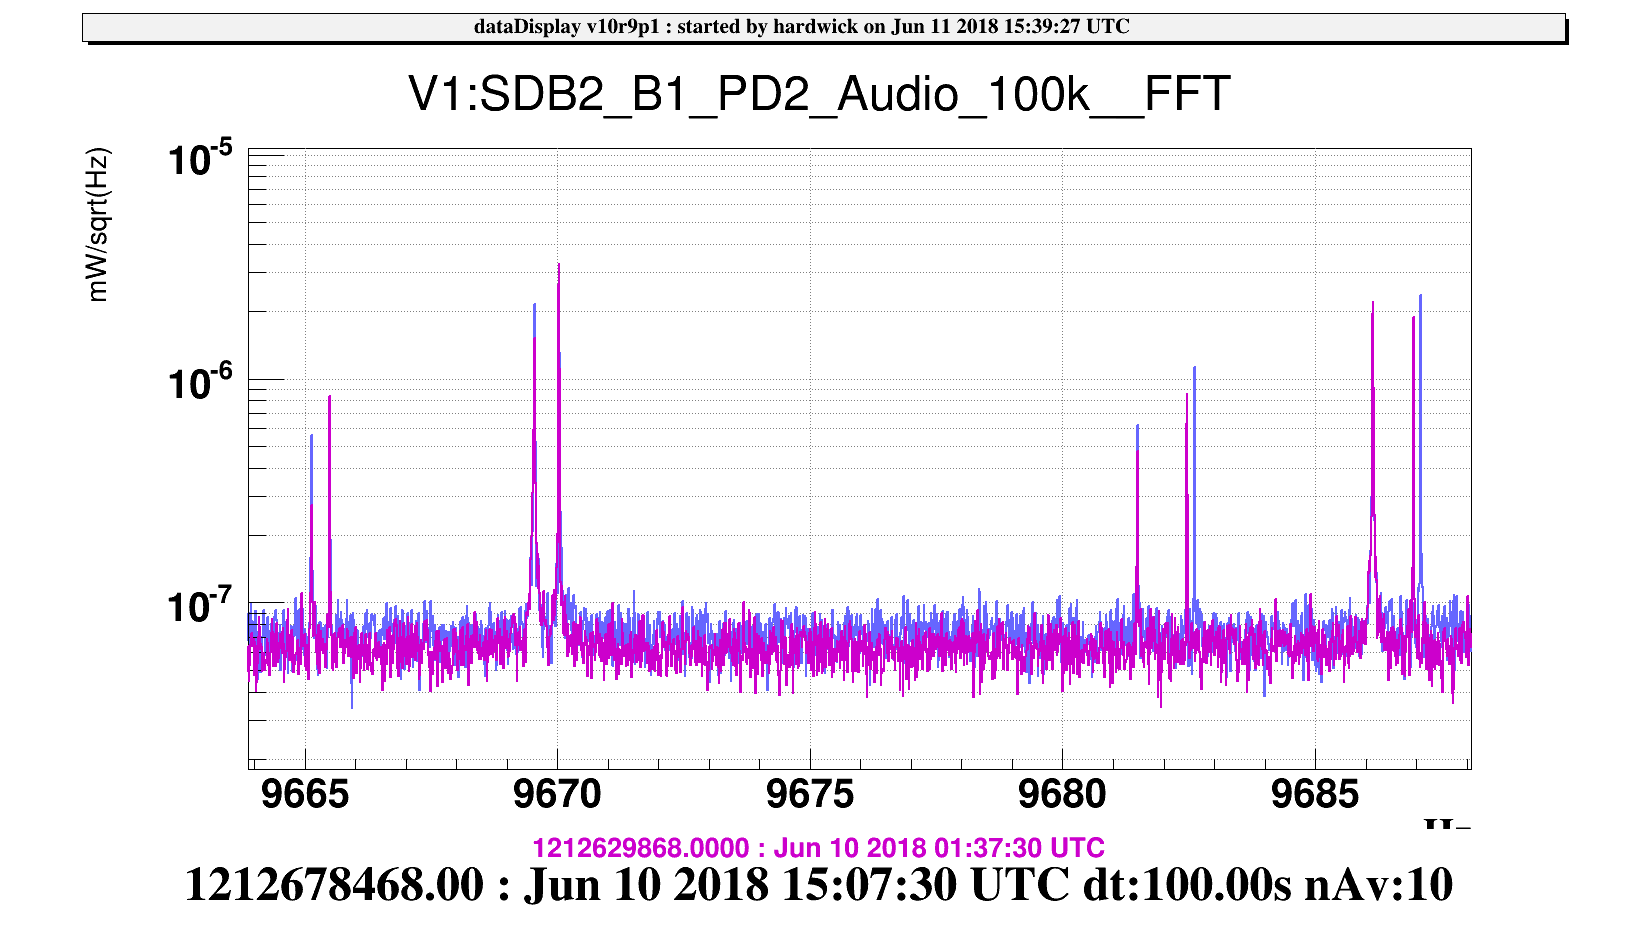
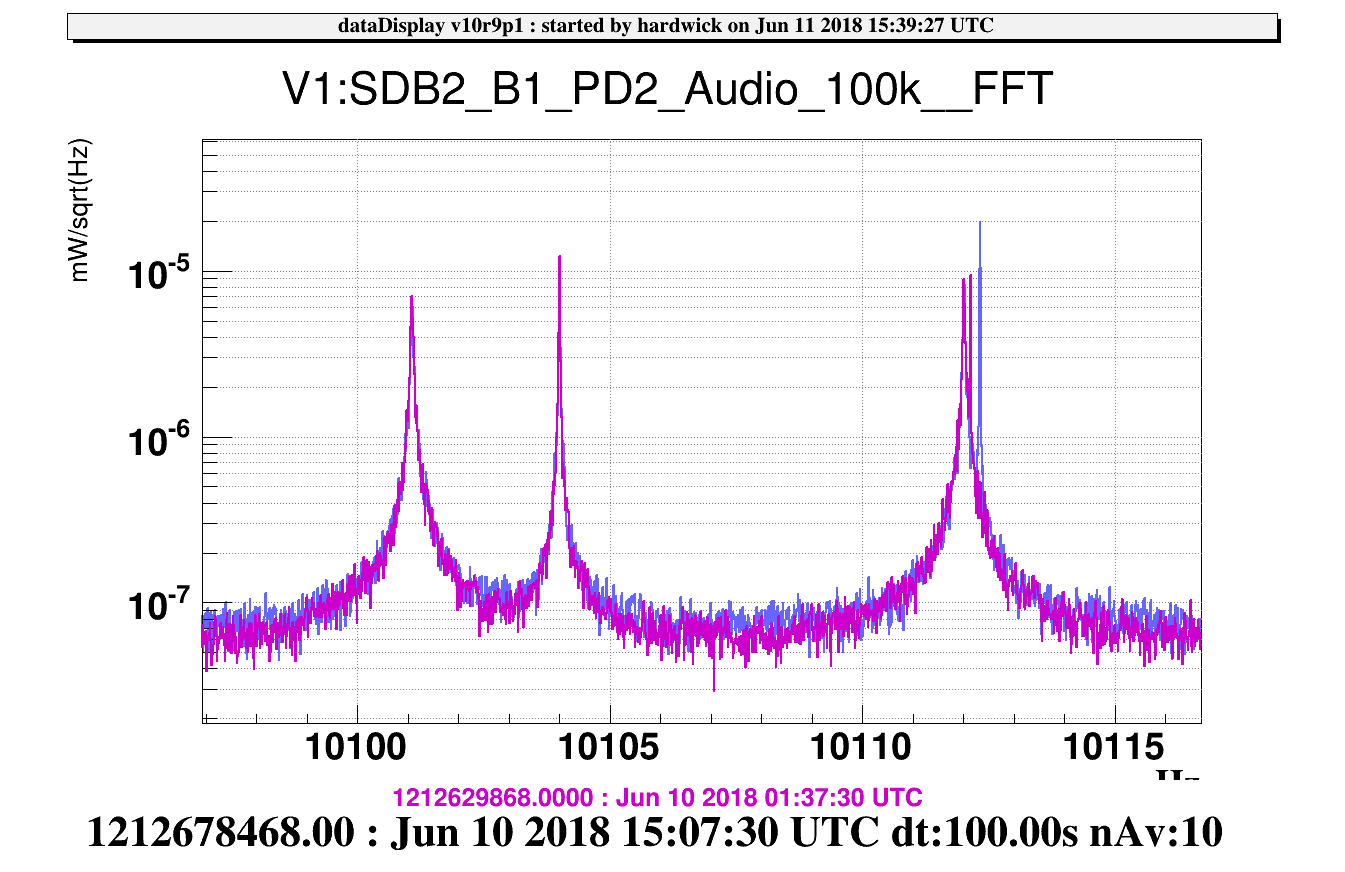
In the rest of the attachments, I zoom into relevant frequency bands (specified in name of attachment) of the high rate V1:SDB2_B1_PD2_Audio_100k channel. We had two several hour locks on Sunday during the WE temperature change, the first lock starting shortly before the temperature change began. In the plots, purple is taken at the beginning of the first lock and blue is taken at end of second lock, at which point room temp had increased by 1 C and RH temp had increased by 0.2 C. I have tried to highlight bands expected to have the highest parametric gain according to Dan Hoak's document VIR-0525A-16, but some bands I couldn't identify.
Of note:
- 7.8 kHz (Drum modes): In 41732, Swinkels noted the missing drum mode; as he suspected, we have two test masses with nominally same drum mode frequency ~7809 Hz. WE mirror drum mode was revealed with temp change.
- 9.6 kHz: It had been thought that there was a mode group around 9670 Hz and 9685 Hz, but this indicates that the two mode groups are mixed.
- 10.1 kHz: again, two masses with almost same nominal mode frequency
- 12.8 kHz: what looks like a test mass mode with rather high amplitude, high PI gain? This would interact with LG02.
- - - - - -
Note: There are upcoming ring heater tests of the end mirrors which will further help with mode identification since the ring heaters will be stepped one at a time. keywords: parametric instability, PI, mirror modes, temperature change


